
South Africa has rich diversity of terrestrial species. Current estimates indicate that South Africa harbours approximately 6% of the world’s vascular plant species; 7% of bird, 5% of mammal, 3% of reptile and 2% of amphibian species. A lower proportion of terrestrial species (14%) are threatened with extinction in comparison to species that have been assessed for the marine (36%) and freshwater (19%) realms. However, there has been a marked increase in the risk of extinction for reptiles, birds, mammals and plants since they were last assessed in 2018. Habitat conversion for agriculture remains the primary pressure on terrestrial species. However, the number of species threatened by energy production, mining, climate change, and illegal wildlife trade has increased over the past eight years.
14%
of 24 678 taxa assessed are
Threatened
of 24 678 taxa assessed are
Threatened
77%
of 2345 taxa assessed for protection are
Well Protected
of 2345 taxa assessed for protection are
Well Protected
8%
of 24 678 taxa assessed are
Data Deficient
of 24 678 taxa assessed are
Data Deficient
37%
of endemic terrestrial taxa assessed for protection are
Under-protected
of endemic terrestrial taxa assessed for protection are
Under-protected
Threat status and pressures
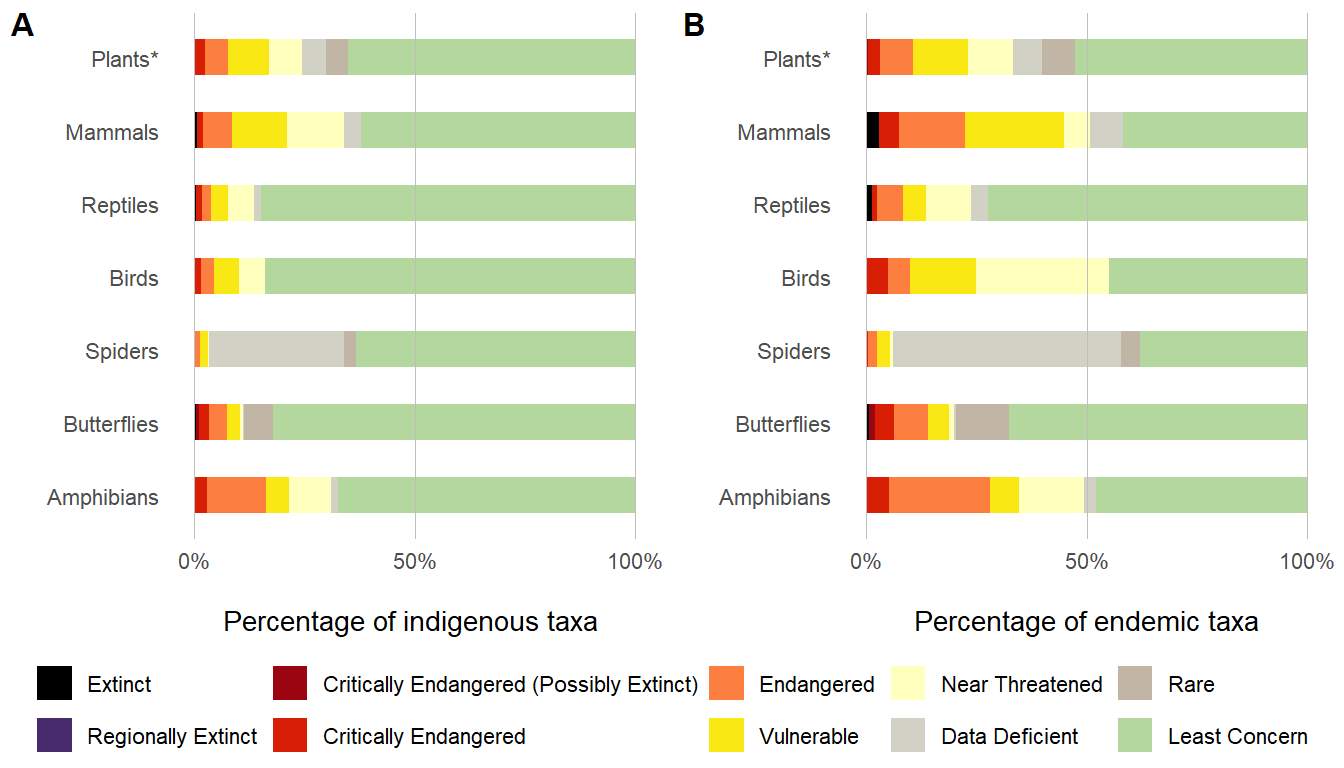
A total of 24 678 terrestrial taxa have been assessed to date using the IUCN Red List criteria. Of these, 14% of taxa are threatened, while in 2018, 13% of 22 667 assessed taxa were threatened. The overall increase in the proportion of species threatened is an indication of increased pressures faced by vertebrates and plants becoming more threatened. The only new taxonomic group included are spiders (2 214 taxa), and they have very low levels of threat (4%).
| Taxonomic grouping | Extinct | Regionally Extinct | Critically Endangered (Possibly Extinct) | Critically Endangered | Endangered | Vulnerable | Near Threatened | Data Deficient | Rare | Least Concern | Total | |
|---|---|---|---|---|---|---|---|---|---|---|---|---|
| Plants* | All indigenous | 0 | 0 | 3 | 20 | 47 | 83 | 67 | 49 | 44 | 587 | 900 |
| Endemic | 0 | 0 | 3 | 16 | 43 | 74 | 60 | 38 | 44 | 310 | 588 | |
| Mammals | All indigenous | 2 | 0 | 0 | 4 | 19 | 36 | 38 | 11 | 0 | 181 | 291 |
| Endemic | 2 | 0 | 0 | 3 | 10 | 15 | 4 | 5 | 0 | 28 | 67 | |
| Reptiles | All indigenous | 2 | 0 | 0 | 5 | 9 | 15 | 24 | 7 | 0 | 345 | 407 |
| Endemic | 2 | 0 | 0 | 2 | 9 | 8 | 16 | 6 | 0 | 112 | 155 | |
| Birds | All indigenous | 0 | 1 | 0 | 9 | 20 | 39 | 40 | 0 | 0 | 564 | 673 |
| Endemic | 0 | 0 | 0 | 1 | 1 | 3 | 6 | 0 | 0 | 9 | 20 | |
| Spiders | All indigenous | 0 | 0 | 0 | 6 | 26 | 37 | 8 | 675 | 60 | 1402 | 2214 |
| Endemic | 0 | 0 | 0 | 6 | 26 | 37 | 8 | 657 | 57 | 482 | 1273 | |
| Butterflies | All indigenous | 3 | 0 | 6 | 18 | 32 | 24 | 6 | 1 | 54 | 656 | 800 |
| Endemic | 3 | 0 | 6 | 18 | 32 | 20 | 5 | 1 | 51 | 283 | 419 | |
| Amphibians | All indigenous | 0 | 0 | 0 | 4 | 18 | 7 | 13 | 2 | 0 | 91 | 135 |
| Endemic | 0 | 0 | 0 | 4 | 17 | 5 | 11 | 2 | 0 | 36 | 75 |
The following sections (and Figure 1 and Figure 2) give brief summaries of findings on terrestrial species. For a full reflection on each taxonomic group, follow links on the headings.
Plants
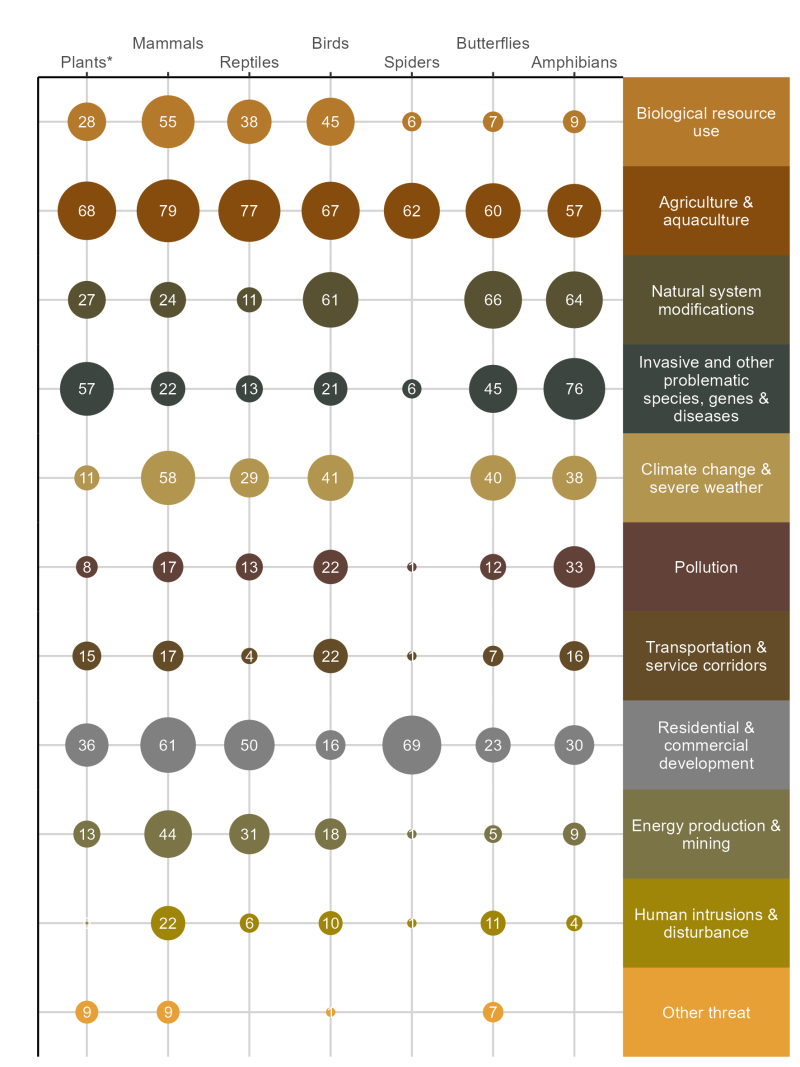
In the representative sample of 900 plant taxa, 17% are threatened with extinction and one in five endemic taxa face extinction risk. Agriculture continues to affect the largest proportion of threatened taxa (68%), while invasive alien species (57%), illegal harvesting (28%), mining-related habitat loss (13%), and drought-related mortality attributed to climate change (11%) are significant pressures. Since 2020, 326 plant species have been uplisted to higher categories of threat, 153 of these (53%) have been uplisted due to the impacts of climate change and drought in the north western parts of South Africa, with 124 of these simultaneously impacted by livestock overgrazing (38%). A total of 118 plant taxa (36%) were uplisted due to the impacts of illegal collection for the ornamental trade. Read more here.
Mammals
A total of 20% of the 291 assessed terrestrial mammal taxa are threatened with extinction, with 42% of South Africa’s 28 endemic mammals facing this risk. The main pressures are habitat loss and degradation from agricultural and urban expansion (impacting 79% of threatened mammal taxa), climate change and extreme weather conditions (particularly prolonged droughts causing severe declines in small mammals), and overexploitation and poaching. Renewable energy development is also emerging as a substantial pressure, particularly affecting bat populations.
Reptiles
All reptiles are grouped in the terrestrial realm, with those dependent on freshwater habitats also discussed in the freshwater realm. The proportion of reptiles threatened with extinction has increased from 5% in 2018 to 8% in 2022. There are 407 reptile taxa in South Africa of which 155 are endemic. A total of 12% of endemic taxa are threatened. Declines are mainly due to habitat loss associated with agriculture (impacting 80% of threatened taxa), followed by residential and commercial development (46%). Species that have become more threatened since 2018 are facing escalating pressures from illegal wildlife trade and mining.
Birds
Of the 673 assessed terrestrial bird taxa, 10% are threatened with extinction, while 25% of South Africa’s 20 endemic terrestrial bird species face elevated extinction risk. The main pressures driving threat status changes include agriculture (impacting 67% of threatened taxa), natural system modifications (61%), and biological resource use (45%), with habitat loss from croplands, plantations, and livestock farming being particularly severe. Species like Botha’s lark (Spizocorys fringillaris) face pressure from the conversion of grasslands for agriculture.
Spiders
South Africa is the first country to have undertaken a comprehensive assessment for spiders. This first assessment indicates very low levels of threat with only four percent of the 2 214 assessed spider taxa threatened with extinction. When compared to assessments for plants (where 17% of assessed taxa are threatened) and vertebrates (where 12% of taxa are threatened), on first examination spiders may appear to be more resilient than other groups. There are, however, high levels of data deficiency with 37% of assessed spider taxa lacking sufficient taxonomic resolution and ecological data to assign a category. The overall threat level for spiders will therefore only be known once these data deficiencies are addressed. The major threats to spiders are residential and commercial development (impacting 69% of threatened taxa) followed by agriculture, particularly crop cultivation, which impacts 62% of threatened species. Ground-dwelling species with poor dispersal abilities are particularly impacted by habitat loss.
Butterflies
A total of 10% of the 800 butterfly taxa assessed are threatened with extinction, while 18% of South Africa’s 419 endemic terrestrial butterfly taxa face extinction risk. While butterflies were last comprehensively assessed in 2017, the leading causes of decline remain natural ecosystem modification (66%) due to inappropriate fire management and the spread of invasive alien plants, followed by loss of habitat to agriculture (60%). Monitoring by members of the Lepidoptera Society between 2017 and 2025 has shown that two species are no longer extant at formerly known populations. The Waterberg copper butterfly (Erikssonia edgei) and the Brenton blue butterfly (Orachrysops niobe) are considered possibly extinct. The Waterberg copper has been lost from its former sites due to lack of burning of its grassland habitat and the Brenton blue butterfly was lost from its only known site due to unprecedented hot fires caused by alien plant fuel loads during the 2017 Knysna fires. These possible extinctions are of high concern given South Africa’s commitment to halt extinctions through our ratification of the Kunming-Montreal Global Biodiversity Framework of the Convention on Biological Diversity.
Amphibians
Of the 135 assessed terrestrial amphibian taxa, 21% are threatened with extinction, with 35% of South Africa’s 26 endemic terrestrial amphibians facing this risk. The main pressures driving threat status changes are invasive and other problematic species (affecting 76% of threatened taxa assessed through diseases, habitat replacement by invasive alien plants, and wetland degradation), followed by natural system modification (64%) related to wetland drainage, and inappropriate fire cycles. Habitat loss and degradation from agricultural activities (57%) is also a significant pressure, and climate change is becoming an increasingly important driver, although the impacts are challenging to quantify.
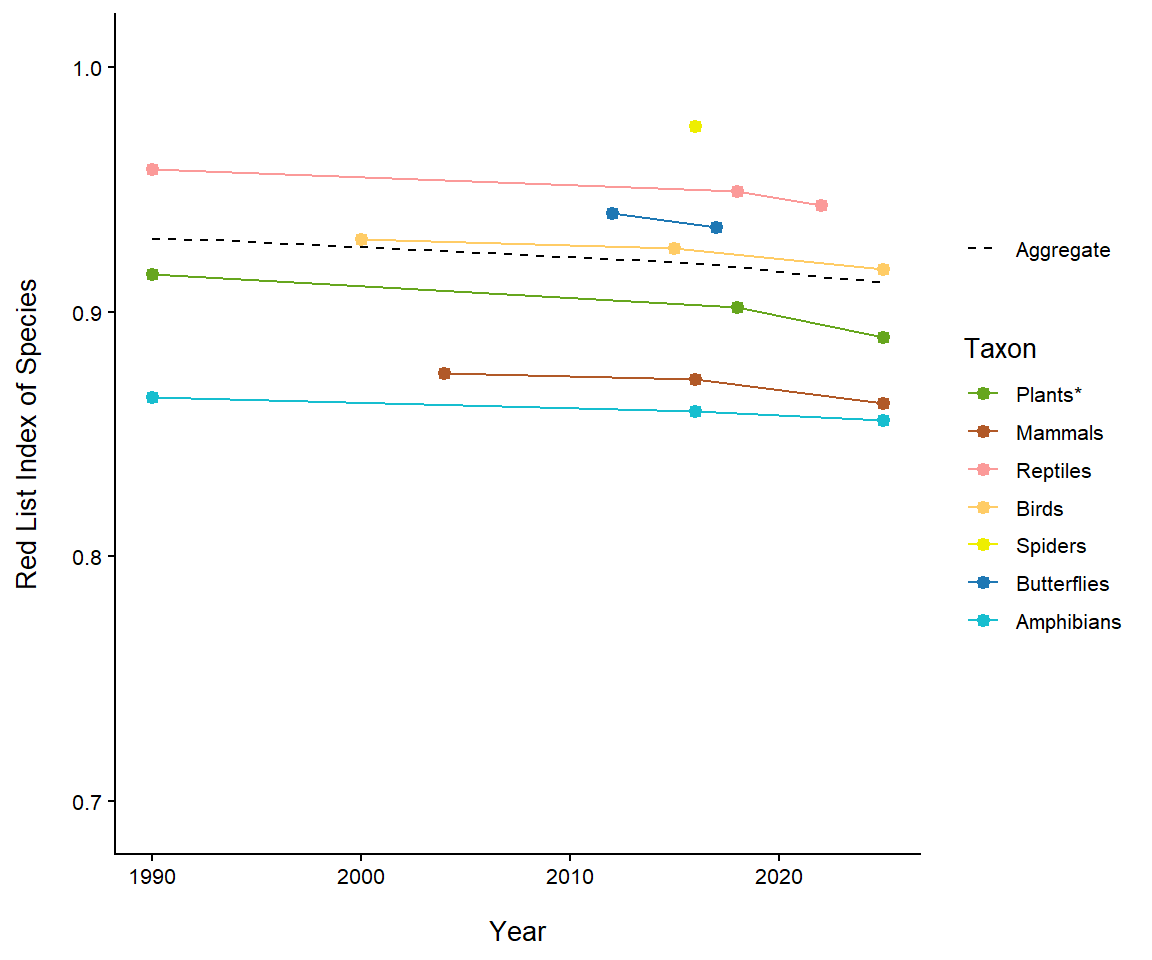
Trends – the Red List Index
The trend in terrestrial species status over time was measured using the globally recognised indicator, the IUCN Red List Index of species (RLI)1. The RLI is calculated for specific taxonomic groups based on genuine changes in taxa assignments to Red List categories over time. The RLI value ranges from 0 to 1, where if the value is 1, all taxa are Least Concern and if the value is 0, all taxa are extinct. The slope of the line indicates how fast the taxonomic group is heading towards extinction.
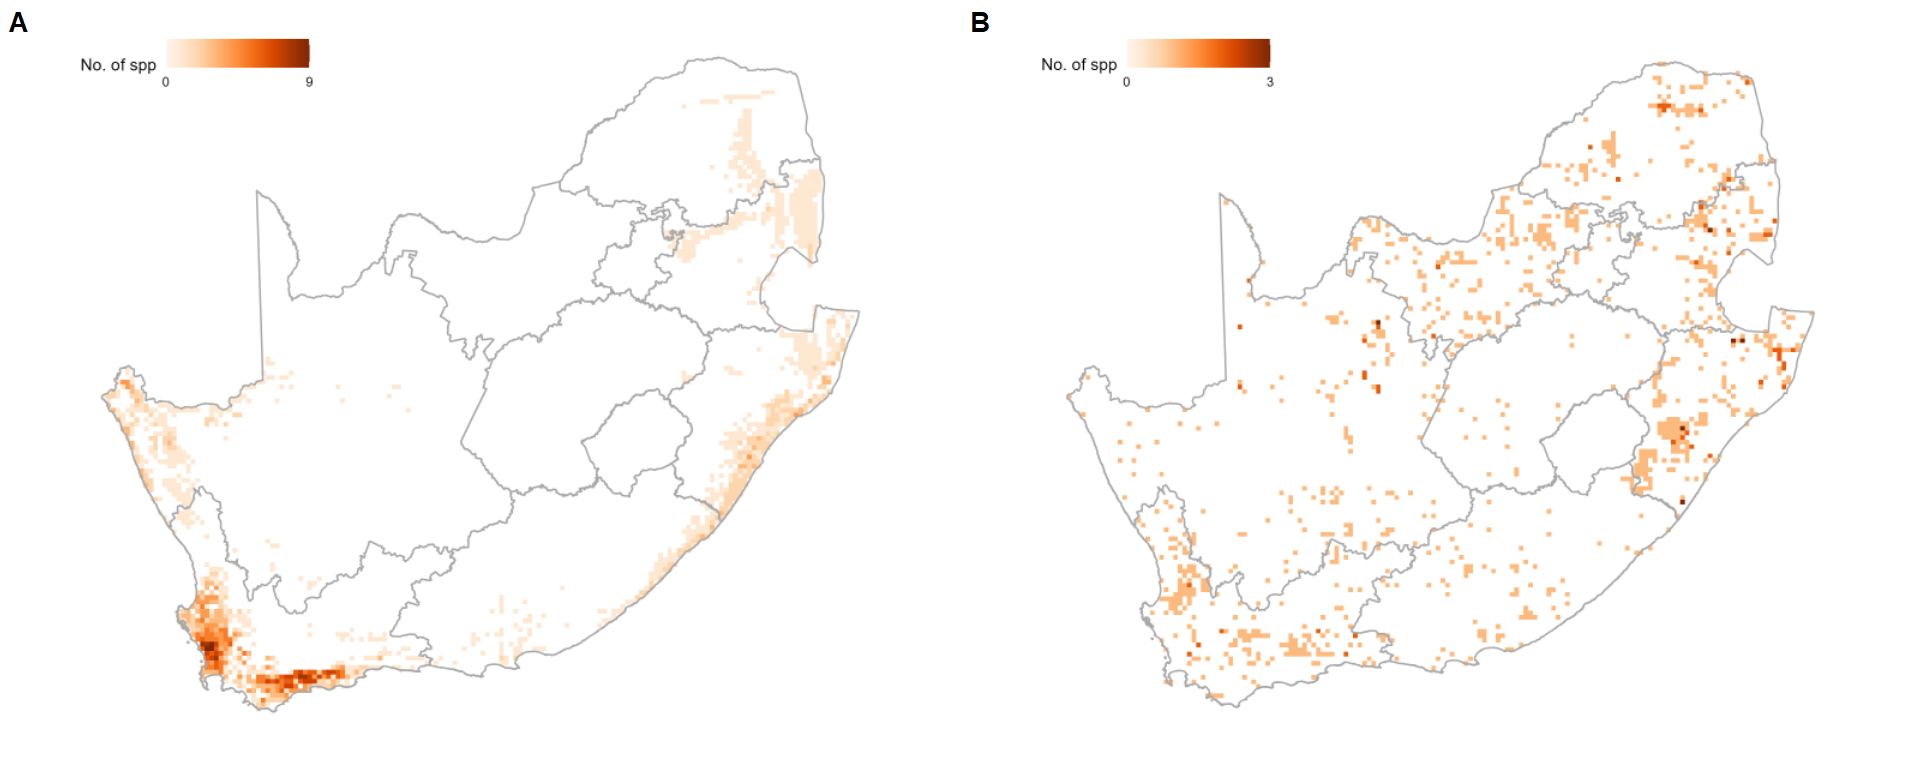
The RLI is calculated only for comprehensively assessed taxonomic groups or groups where a representative sample has been selected. Changes in status over time has been tracked for six taxonomic groups that occur in the terrestrial realm (Figure 3). Increases in extinction risk is evident for most groups, but a marked increase in rate of extinction since the last assessment is evident from the change in slope of declines for reptiles, birds, mammals and plants. Increases in threat status for birds has largely been because of increasing levels of pollution and other forms of habitat degradation, while the main drivers of declines for mammals, plants and reptiles have been climate change and loss of habitat for mining and renewable energy development (the taxa that have changed status and the reason causing the uplisting to higher threat categories are included on each taxon page). Most of the declines to plants are taking place in the Northern Cape Province (Figure 4) with the Namaqualand region most severely impacted. Anthropogenic impacts from livestock farming, mining, and road construction are being amplified by climate change factors including an unprecedented nine-year drought (2011-2019), increased temperatures, and stronger winds that cause cascading desertification processes through soil erosion and sand burial. This same region is being heavily impacted by illegal wildlife trade of ornamental succulent and geophytic plants. Animals that have increased in threat status are spread across South Africa but are concentrated in the areas with high rates of recent habitat loss.
Protection level
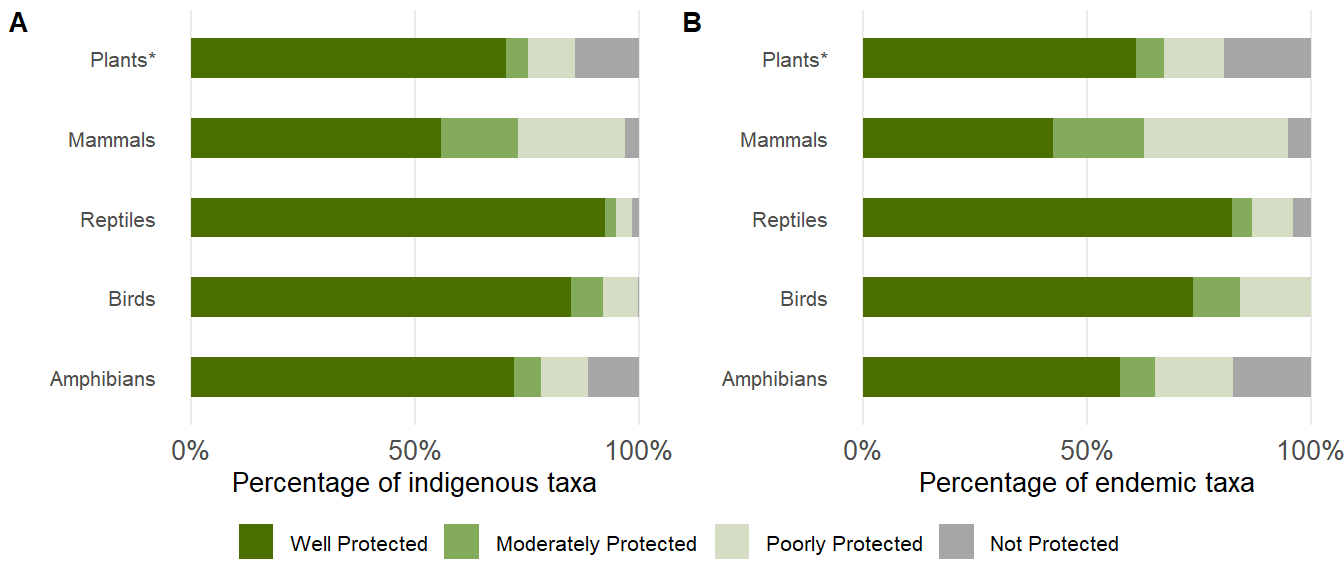
A total of 70% of plant species are Well Protected (based on a representative sample of 900 taxa). All mammal, reptile, bird, and amphibians taxa were assessed for protection level, and overall 77% of these terrestrial animals are considered Well Protected.
The overall levels of protection for terrestrial species are shown in Figure 5. The details of protection level for each taxon group and the trends and changes in status since 2018 can be found in the integrated findings webpages under Species threat status and protection level.
Approach
Threat status assessments
See details about how the IUCN Red List assessments are conducted here
Protection level assessments
See details about how the protection level indicator was conducted here
Recommended citation
Raimondo, D.C., Van Der Colff, D., Monyeki, M.S., & Hendricks, S.E. 2026. Species status: Terrestrial realm. National Biodiversity Assessment 2025. South African National Biodiversity Institute. http://nba.sanbi.org.za/.
References
1. Butchart, S.H.M. et al. 2004. Measuring global trends in the status of biodiversity: Red List indices for birds. PLoS Biology 2: https://doi.org/10.1371/journal.pbio.0020383