
13%
of 728 species assessed are
Threatened
of 728 species assessed are
Threatened
86%
of 652 species assessed are
Well Protected
of 652 species assessed are
Well Protected
7%
of 652 species assessed are
Poorly Protected
of 652 species assessed are
Poorly Protected
Key findings
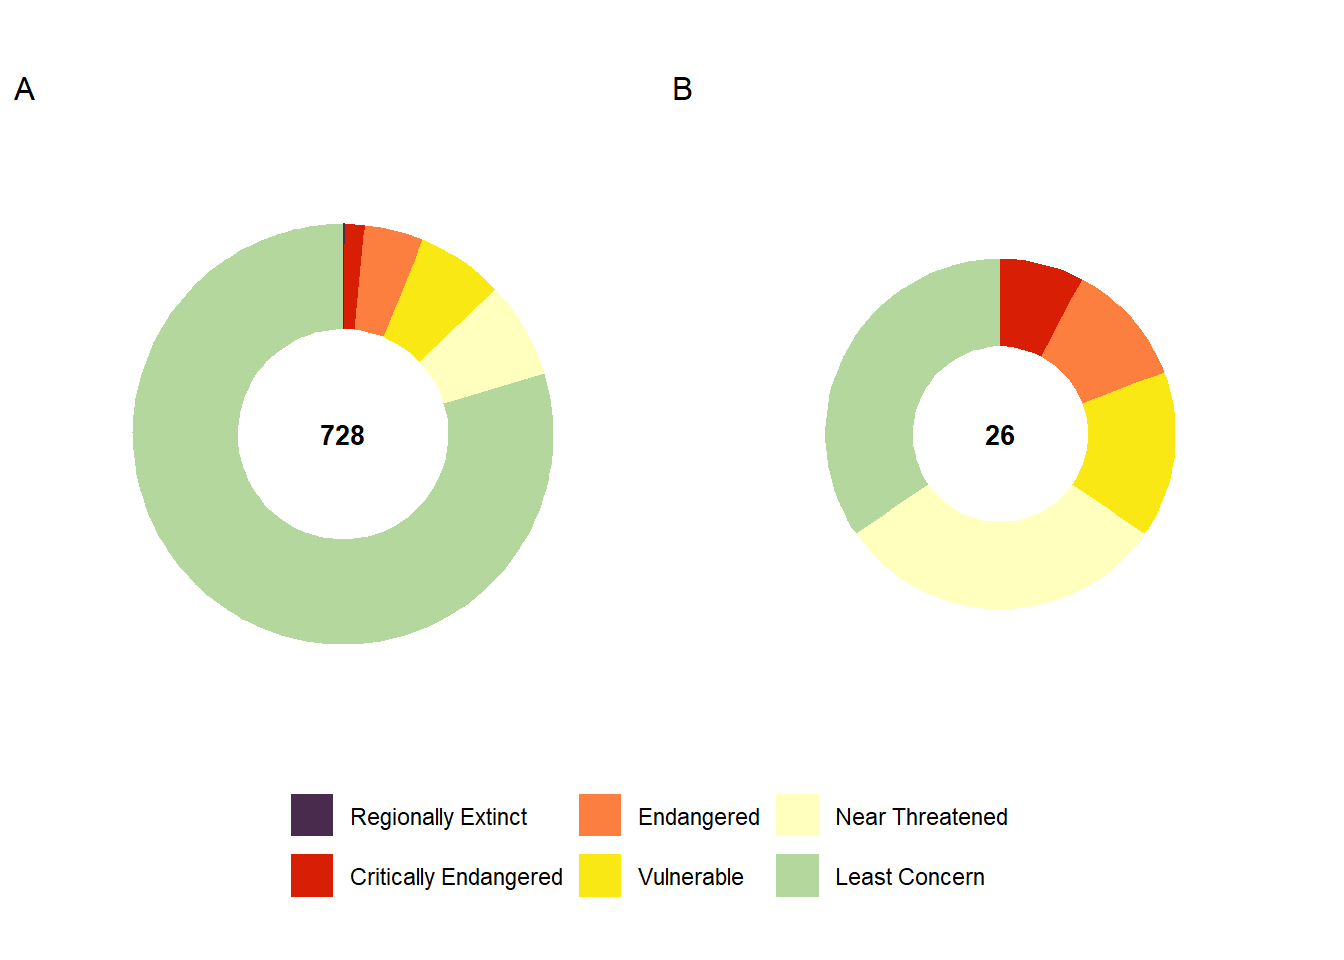
The latest bird assessment evaluated 728 species, and 26 of these are endemic to South Africa, Eswatini, and Lesotho.
Nearly 13% (93) of assessed bird species are threatened with extinction, with another 7% (54) assessed as Near Threatened.
Among South Africa’s endemic bird species, 34% (9 out of 26) of are threatened with extinction, placing full responsibility for their protection on the Republic of South Africa.
Eight species were downlisted after some improvement in threat status, however birds are in general becoming increasingly threatened with extinction, with 39 species uplisted to higher threat categories.
The main pressures driving change in threat status have remained similar to those driving change in the previous assessments. However, in this assessment, the plight of waterbirds has been highlighted, with many waterbirds being uplisted to a higher category of threat.
Freshwater ecosystem condition must improve to safeguard these species, but doing so will require substantial political will and resources. Because many freshwater species are congregatory and therefore susceptible to disease outbreaks, effective water management and protection of key sites are critical to slowing their decline. Urban freshwater systems also provide important opportunities for citizen-led restoration and monitoring.
Using a subpopulation method based on proximal protected areas, a large proportion of bird species were found to be Well Protected within the South African protected area network (86%, 561 species); with only 7% Poorly Protected.
When protection level is assessed using a Minimum Conservation Population (MCP) approach that incorporates species-specific abundance thresholds, protection levels are far lower: only 10% of assessed species are Well Protected, while the vast majority (90%) remain inadequately protected despite occurring within the protected area network.
Threat status
South Africa, Lesotho, and Eswatini host a rich assemblage of bird species, with many endemics that are of global conservation interest. The region has a long history of publishing lists of threatened bird species, with Red Data Books published in 1976, 1984, 2000 and most recently in 2025, when 132 species were assessed with an IUCN threat category greater than Least Concern. Given growing evidence of shifting population trends and continued anthropogenic pressures reshaping habitats, an updated regional Red List assessment was conducted by BirdLife South Africa from late 2021 to early 2025, with contributions from 138 species experts. See approach section for further details on how the assessment was conducted.
Nearly 13% (93) of assessed bird species are threatened with extinction, with another 7% (54) assessed as Near Threatened. Of South Africa’s endemic bird species, 34% (9 out of 26) are threatened with extinction (Figure 2).
A total of 25 species were uplisted from LC or Not Evaluated to higher threat categories due to increasing risk of extinction. Most of these (n = 16) were waterbirds, followed by terrestrial (n = 6), seabirds (n = 2) and a raptor species (n = 1).
| Taxon | Regionally Extinct | Critically Endangered | Endangered | Vulnerable | Near Threatened | Least Concern | Total |
|---|---|---|---|---|---|---|---|
| Overall birds | 1 | 11 | 33 | 49 | 54 | 580 | 728 |
| Endemic birds | 0 | 2 | 3 | 4 | 8 | 9 | 26 |
NoteBox 1. Conservation success story: the white-winged flufftail (Sarothrura ayresi)
The white-winged flufftail (Sarotheura ayresi) is one of Africa’s rarest and most threatened waterbirds, with breeding confirmed only in South Africa and Ethiopia. Previously listed as Critically Endangered (CR), the species was downlisted to Endangered (EN) in South Africa in 2025. This change does not reflect a reduction in pressures, rather a better scientific understanding of its distribution and population size, accompanied by significant conservation success in safeguarding its specialised wetland habitat.
Since 2020, BirdLife South Africa’s Wetland and White-winged Flufftail Conservation Project has spearheaded efforts to conserve high-elevation wetlands, the species’ breeding habitat during the wet season. The project vision is to maintain and improve the quality and quantity of these wetlands to support threatened species and secure ecosystem services for local communities. The approach integrates management, restoration, protection, stewardship, advocacy, awareness, and research using the white-winged flufftail as a flagship species for wetland conservation.
Key achievements include:
Management and restoration: publication of Best Practice Guidelines for High-Elevation Wetland and Peatland Management in Southern Africa in multiple local languages, bridging the gap between scientific research and land users responsible for stewarding wetlands.
Protection and stewardship: declaration of Middelpunt Nature Reserve (527 ha) and designation as a Ramsar Site, expansion of the Greater Lakenvlei Protected Environment (21 400 ha), and new stewardship agreements in Mpumalanga and KwaZulu-Natal to conserve biodiversity alongside daily land-use activities.
Community engagement: establishment of the Steenkampsberg Birding Routes and employment of a community bird guide at Ntsikeni Nature Reserve to promote eco-tourism and local custodianship through financial incentives.
Policy and advocacy: publication of surveying and mitigation guidelines for environmental impact assessments of developments within the species’ distributional range, endorsed by the Department of Forestry, Fisheries and the Environment.
Awareness: publication of two children’s books (and audiobooks) for different age groups and raising awareness among children and adults during the annual Flufftail Festival hosted on World Wetlands Day.
Research: dedicated surveys using passive monitoring equipment provided the first empirical population estimate of ~900 breeding pairs (1 800 mature individuals) across just 20 km² of suitable habitat in South Africa.
These collective efforts, underpinned by partnerships with government, landowners, NGOs, universities, and international agreements (e.g. AEWA and CMS), directly informed the 2025 IUCN Regional Red List assessment for the white-winged flufftail. The protection level for the species has changed from “Not Protected” to “Poorly Protected” thanks to the declaration of key protected areas. The white-winged flufftail now qualifies as Endangered under criterion B2ab(iii), highlighting both its precarious status and the tangible conservation gains achieved through science-based collaborative action.
By using the white-winged flufftail as a flagship species for wetland conservation, conservationists have not only improved prospects for one of Africa’s most elusive birds, but also safeguarded critical wetlands that sustain biodiversity and provide water resources for many downstream communities.
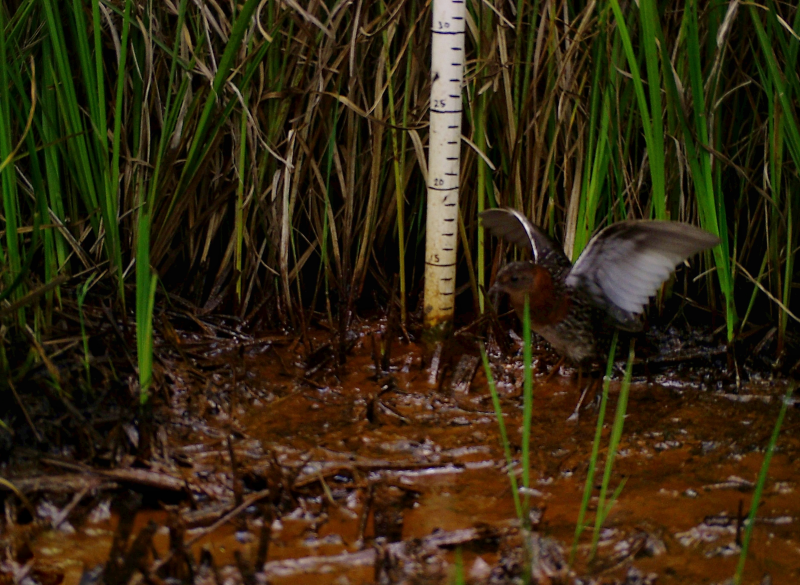
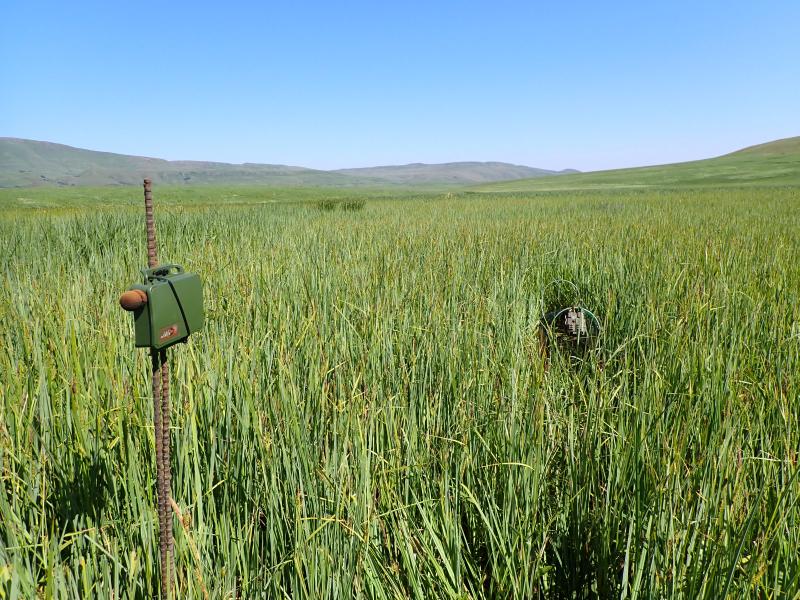
White-winged flufftail, landing (left), while monitoring is taking place in its habitat (right). (© Kyle J. Lloyd)
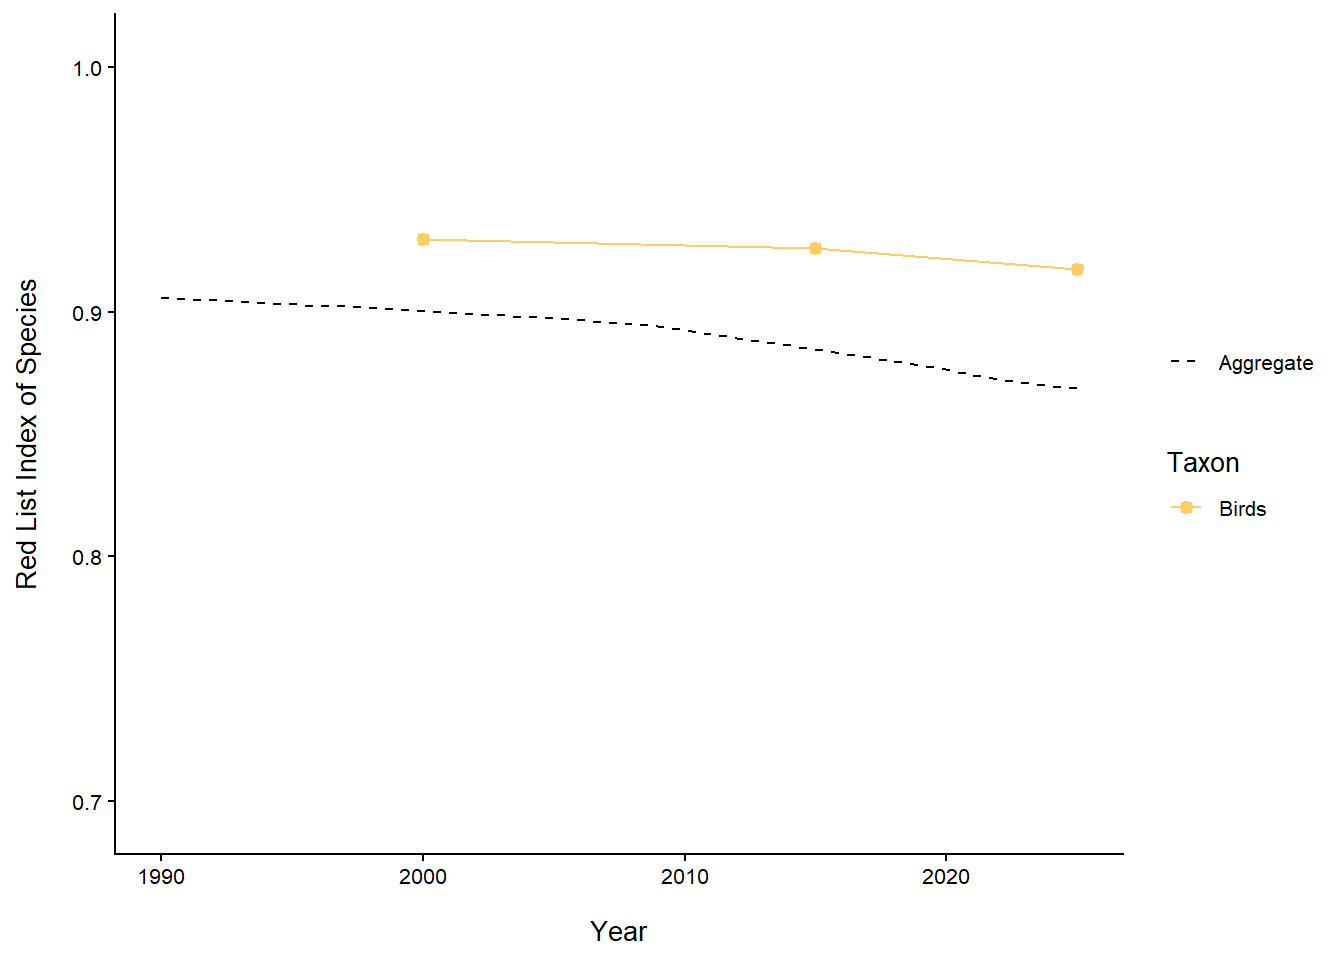
Trends – the Red List Index
The trend in species status over time was measured using the globally recognised indicator, the IUCN Red List Index of species (RLI)1. The RLI is calculated based on genuine changes in Red List categories over time. The RLI value ranges from 0 to 1. At a value of 1, all species are at low risk of extinction (Least Concern), while a value of 0 indicates that all species are extinct. The slope of the line indicates the rate at which species are becoming more threatened over time. The Red List Index of birds was calculated for all species that have been reassessed (n = 729).
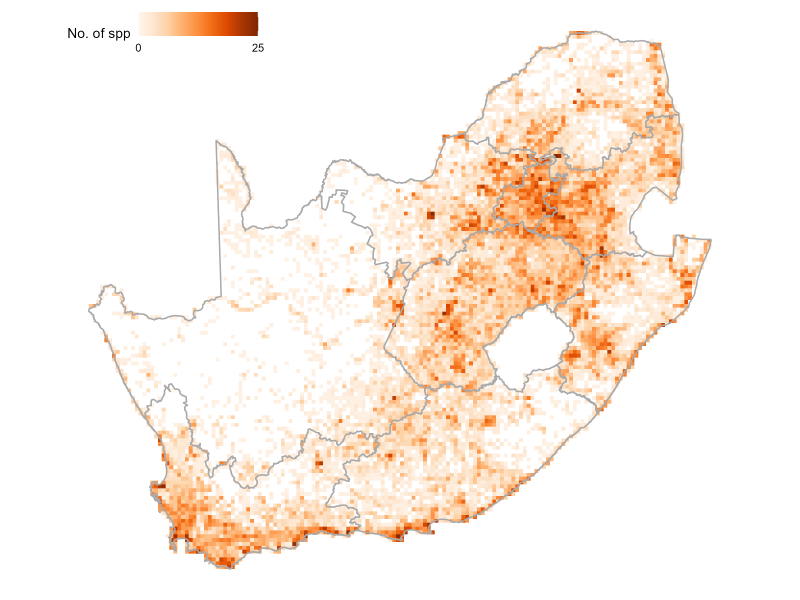
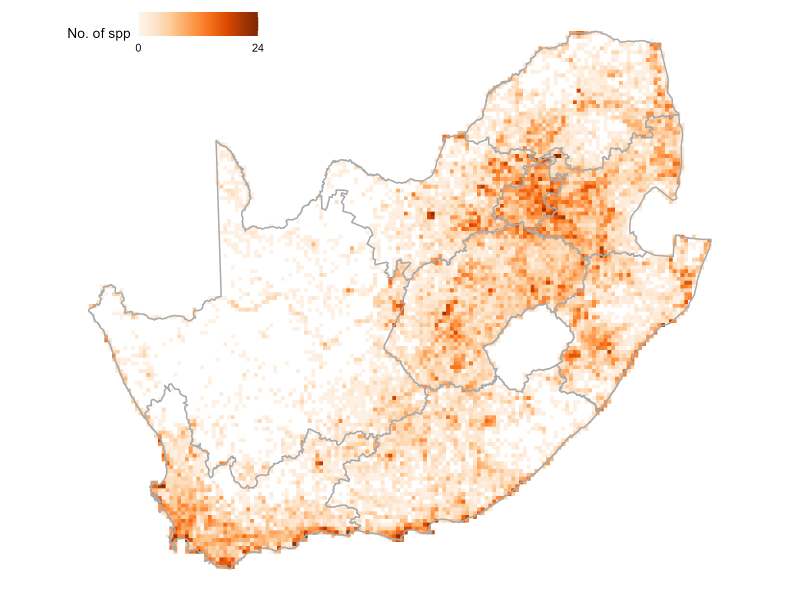
It was found that many species have changed Red List categories over the last decade. Results indicate that the average RLI score decreased between 2015 and 2025, which means that South African bird species’ risk of extinction is increasing. A total of 147 species had a threat status higher than Least Concern for 2025. Although 131 species showed no change in status, 39 deteriorated (moving into higher risk categories) and 8 improved. The analysis highlights that habitat degradation, invasive species, powerline collisions, climate change, and fisheries impacts remain pressing conservation issues. These pressures are spread quite widely across South Africa, as indicated by the distributions of species that have increased in threat status since 2015 (Figure 4). Targeting these pressures is essential, especially for species newly classified as Vulnerable or Endangered.
| Taxon | Change in status (2015 to 2025) | Endemism | Direction of change | Reason for change |
|---|---|---|---|---|
| Forest buzzard* | LC to NT | Endemic | Uplist | Agriculture and aquaculture |
| Blue crane | NT to VU | Non-endemic | Uplist | Agriculture and aquaculture, Climate change |
| Wattled crane | CR to EN | Non-endemic | Downlist | Population increasing |
| African darter | LC to NT | Non-endemic | Uplist | Natural system modification, pollution |
| Knob-billed duck | LC to NT | Non-endemic | Uplist | Natural system modification |
| Maccoa duck | NT to VU | Non-endemic | Uplist | Natural system modification, pollution, disease |
| White-backed duck | LC to NT | Non-endemic | Uplist | Disease, pollution |
| Yellow-billed duck | LC to NT | Non-endemic | Uplist | Natural system modification, pollution |
| Steppe eagle | VU to EN | Non-endemic | Uplist | Agriculture and aquaculture, persecution |
| Great egret | LC to NT | Non-endemic | Uplist | Natural system modification, pollution |
| Yellow-billed egret | LC to NT | Non-endemic | Uplist | Natural system modification, pollution |
| Lanner falcon | VUto NT | Non-endemic | Downlist | Improved knowledge |
| Red-footed falcon | NT to VU | Non-endemic | Uplist | Agriculture and aquaculture, persecution |
| Lesser flamingo | NT to VU | Non-endemic | Uplist | Natural system modification, pollution, climate change |
| Great-crested grebe | NT to VU | Non-endemic | Uplist | Natural system modification, pollution, climate change |
| Hamerkop | LC to NT | Non-endemic | Uplist | Natural system modification, climate change |
| Black-crowned night heron | LC to NT | Non-endemic | Uplist | Natural system modification, pollution |
| Southern bald ibis* | VU to NT | Endemic | Downlist | Targeted conservation action means population increasing |
| Lesser kestrel | NT to VU | Non-endemic | Uplist | Climate change, persecution, agriculture and aquaculture |
| Half-collared kingfisher | NT to VU | Non-endemic | Uplist | Climate change, natural system modification, pollution |
| Black-winged kite | LC to NT | Non-endemic | Uplist | Ecosystem modification |
| Red knot | LC to NT | Non-endemic | Uplist | Climate change, residential and commercial development, pollution |
| Blue korhaan* | LC to VU | Endemic | Uplist | Energy production and mining, agriculture and aquaculture |
| Botha’s lark* | EN to CR | Endemic | Uplist | Agriculture and aquaculture, climate change, human intrusion and disturbance |
| Melodious lark | LC to NT | Non-endemic | Uplist | Natural system modification, climate change, agriculture and aquaculture |
| Marsh owl | LC to NT | Non-endemic | Uplist | Agriculture and aquaculture, natural system modification, transportation and service corridors |
| Chestnut-banded plover | NT to VU | Non-endemic | Uplist | Residential and commercial development, natural system modification, pollution |
| Grey plover | LC to NT | Non-endemic | Uplist | Climate change |
| Kittlitz’s plover | LC to NT | Non-endemic | Uplist | Residential and commercial development, natural system modification, pollution |
| Sanderling | LC to NT | Non-endemic | Uplist | Residential and commercial development, natural system modification, climate change |
| Curlew sandpiper | NT to VU | Non-endemic | Uplist | Climate change, human intrusion and disturbance, residential and commercial development |
| Cape shoveler | LC to NT | Non-endemic | Uplist | Ecosystem modification, biological resource use, disease |
| Abdim’s stork | NT to LC | Non-endemic | Downlist | Improved knowledge |
| Black stork | VU to EN | Non-endemic | Uplist | Natural system modification, climate change, transportation and service corridors |
| Red-billed teal | LC to NT | Non-endemic | Uplist | Natural system modification, pollution, disease |
| Orange ground thrush | NT to VU | Non-endemic | Uplist | Agriculture and aquaculture, natural system modification |
| Ruddy turnstone | LC to NT | Non-endemic | Uplist | Residential and commercial development, climate change, natural system modification |
| Cape vulture | EN to VU | Non-endemic | Downlist | Population increasing |
| Lappet-faced vulture | EN to CR | Non-endemic | Uplist | Biological resource use, persecution, natural system modification |
| Ground woodpecker* | LC to NT | Endemic | Uplist | Agriculture and aquaculture, climate change, natural system modification |
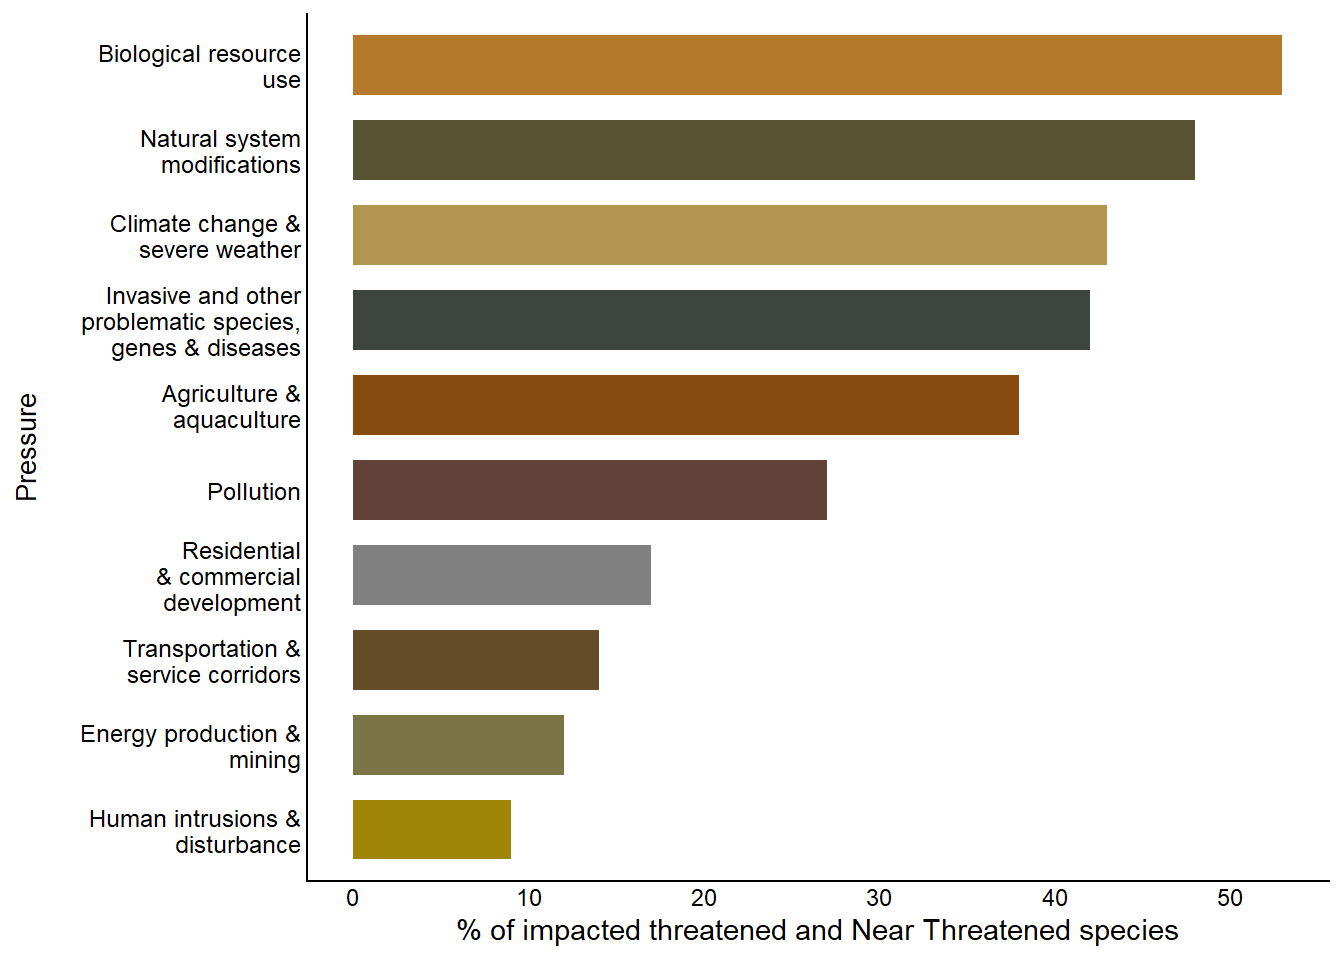
Pressures
South Africa’s threatened and Near Threatened birds face multiple interacting pressures, with no single dominant threat1. Across 147 species of conservation concern, the most common threats are biological resource use (53%), natural system modification (49%), climate change (44%), invasive species (43%), and agriculture (39%). Threat patterns differ across terrestrial, freshwater, estuarine and marine systems (Figure 5).
Biological resource use
(53% overall; 45% terrestrial; 66% marine; 49% inland aquatic; 43% estuarine/coastal)
This threat is dominated by direct mortality from hunting, trapping, poisoning and fisheries bycatch. It is especially severe for seabirds affected by incidental capture and prey depletion, and for terrestrial species such as vultures (see Box 3), bustards and cranes impacted by poisoning and hunting. It remains a leading driver of declines.
Natural system modifications
(49% overall; 61% terrestrial; 89% inland aquatic; 37% estuarine/coastal; limited for marine)
Hydrological alteration from dams, abstraction and wetland degradation is the dominant pressure, especially for freshwater birds (see Box 3 on the Freshwater species summary page). Terrestrial birds are strongly affected by altered fire regimes, bush encroachment and habitat conversion, particularly in grasslands and fynbos.
Climate change and severe weather
(44% overall; 41% terrestrial; 54% inland aquatic; 54% estuarine/coastal; 34% marine))
Climate change intensifies droughts, floods, storms and heat stress across all realms. Freshwater and coastal birds are most affected, while marine birds face shifting prey and storm damage. Terrestrial impacts include heat stress and aridification, especially for montane and arid-habitat species.
Invasive species and diseases
(43% overall; 21% terrestrial; 43% inland aquatic; 34% estuarine/coastal; 85% marine)
Marine birds are heavily impacted by invasive predators and diseases such as avian influenza. Freshwater systems are affected by invasive plants and fish, while terrestrial impacts are mainly through habitat alteration. Disease risks are increasing across all realms.
Agriculture and aquaculture
(39% overall; 68% terrestrial; 14% inland aquatic; 3% estuarine/coastal; negligible marine)
Agriculture is a dominant pressure on terrestrial birds through habitat loss to cultivation (see Box 2), grazing and plantations, especially in grasslands and renosterveld.
Additional pressures
- Pollution: Major threat to freshwater birds
- Urban development: Mainly affects estuarine/coastal species
- Transport: Collision mortality
- Energy & mining: Wind energy impacts on raptors
- Human disturbance: Nesting and roosting sensitivity
These threats often act cumulatively. Overall, this threat assessment highlights that no single threat acts in isolation. Biological resource use, system modification, climate change, invasive species and agriculture all play significant roles, with relative importance varying across realms. Effective conservation will therefore require ecosystem-specific strategies integrated into a national framework capable of tackling multiple simultaneous pressures.
NoteBox 2. Habitat loss in the grasslands: Botha’s lark (Spizocorys fringillaris)
Botha’s lark is one of South Africa’s most threatened birds, now assessed as Critically Endangered, with only 340 individuals estimated to be remaining2. Endemic to the high-altitude grasslands of Mpumalanga and the Free State, its tiny global population has declined by more than 80% over the past decade. The primary driver of this decline is habitat loss and degradation, with over 90% of its preferred short-grassland habitat converted to croplands (maize and soya), or altered by inappropriate grazing practices.
Recent field surveys, modelling of preferred habitat extent, and SABAP2 data trends confirm alarming range contractions, including the near disappearance of the species from its former northern and southern distribution limits. The few remaining strongholds, such as the Wakkerstroom–Daggakraal region, are under increasing pressure from maize farming, pasture improvement, and invasive alien plants. Habitat fragmentation further isolates subpopulations, limiting dispersal and increasing extinction risk.
Botha’s lark exemplifies the broader crisis facing South Africa’s sourveld and highland grasslands, ecosystems that provide essential ecosystem services such as water regulation and carbon storage but remain among the most poorly protected ecosystem types. A range of other threatened species call these areas home, including Rudd’s lark (Heteromirafra ruddi) and yellow-breasted pipit (Anthus chloris).
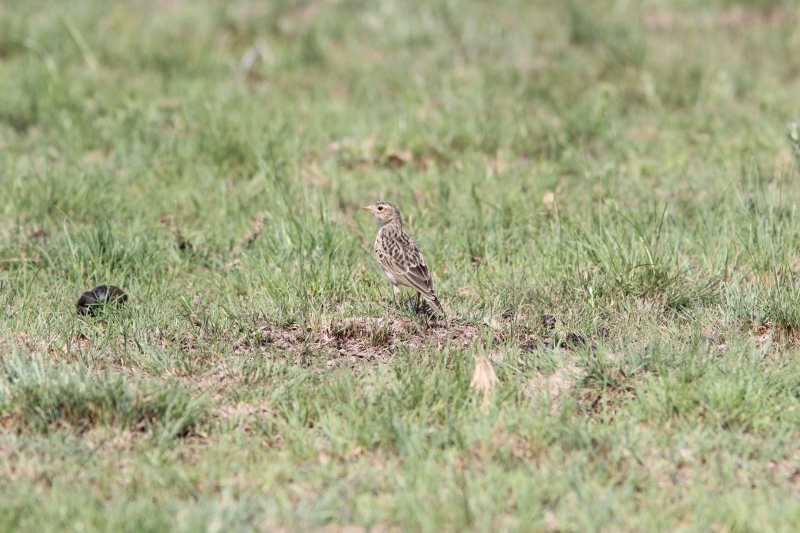 Botha’s lark (Spizocorys fringillaris) on its breeding grounds in the high altitude grasslands of Wakkerstroom, Mpumalanga. (© David Ehlers Smith)
Unfortunately, most of the Botha’s Lark habitat falls outside of formal protected areas. Conservation responses have included stewardship agreements with private landowners, community outreach, and exploration of targeted habitat restoration. However, without urgent expansion of formal protection and sustainable landuse practices, this iconic species faces imminent extinction.
See full assessment details here.
NoteBox 3. Poisoning crisis: Africa’s vultures on the brink
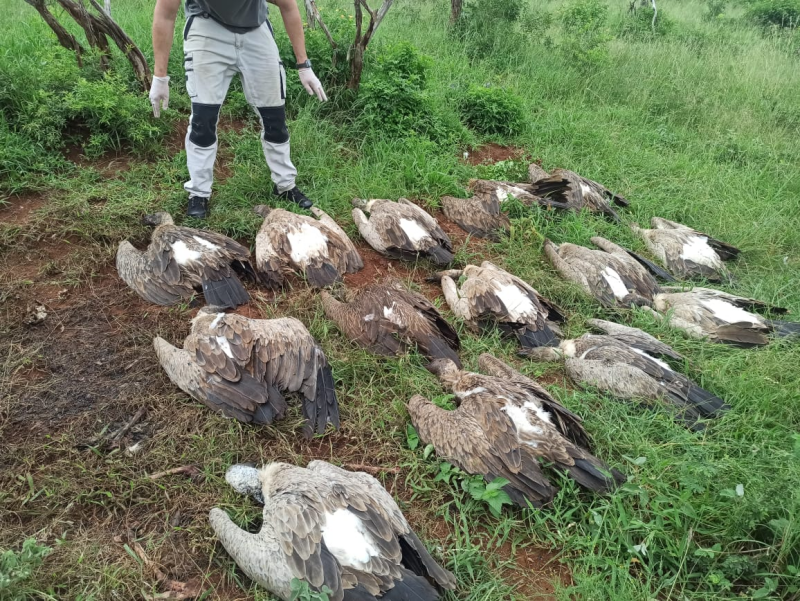 Mass poisoning event of African white backed vulture (Gyps africanus) in Zululand, KwaZulu-Natal. (© Chris Kelly)
Poisoning is the single greatest driver of vulture declines across Africa. In southern Africa and beyond, almost all scavenging vulture species are now listed as Critically Endangered: white-headed (Trigonoceps occipitalis), hooded (Necrosyrtes monachus), white-backed (Gyps africanus), bearded (Gypaetus barbatus), and lappet-faced (Torgos tracheliotos) vultures. Only the Cape vulture (Gyps coprotheres), which breeds in colonies and has benefited from decades of conservation action, and the palm-nut vulture (Gypohierax angolensis), with its specialised diet of raffia palm fruit and aquatic prey, are not considered Critically Endangered.
Among the most devastating practices is sentinel poisoning, where poachers deliberately lace carcasses with toxic substances to eliminate vultures that might otherwise reveal illegal activities by circling above a kill. These events can wipe out hundreds of individuals in a single incident, impacting decades of conservation efforts.
Vultures are also highly vulnerable to secondary poisoning. In many rural areas, carcasses are baited with pesticides or poisons to target carnivores such as jackals, caracals, and lions. When vultures descend to feed, they are killed unintentionally in large numbers. Because these birds forage communally, even one poisoned carcass can have catastrophic consequences.
Other sources of poisoning continue to exacerbate the crisis. Veterinary drugs (e.g. Diclofenac) used to treat livestock can remain in carcasses and are toxic to scavengers. Lead poisoning from ammunition fragments in carcasses has been detected in several vulture populations. Even contaminated water sources pose risks in areas where agricultural chemicals are poorly regulated. Collectively, these threats undermine not only vulture populations but also the ecological role they fulfil.
The decline of vultures has far-reaching consequences for ecosystems and people. As nature’s clean-up crew, vultures rapidly dispose of carcasses, helping to prevent the spread of diseases such as anthrax and rabies. Their disappearance risks creating a dangerous vacuum in which carcasses linger, promoting outbreaks that threaten wildlife, livestock, and human health alike.
Recognising the urgency of this crisis, governments and conservation organisations have developed targeted responses. The International Vulture Multi-species Action Plan3 and the South African Multi-species Biodiversity Management Plan for Vultures4 both identify poisoning as the top conservation priority. Actions include phasing out the most dangerous agrochemicals, raising awareness among farming and hunting communities, tracking individual vultures, and deploying rapid-response poison intervention units. One striking example of the latter occurred in May 2025 in Kruger National Park, when the Endangered Wildlife Trust and SANParks mounted a large-scale rescue after an elephant carcass was poisoned, managing to save more than 80 vultures through rapid detection, treatment and rehabilitation. Such coordinated responses are vital, yet prevention remains the ultimate goal.
Despite these efforts, numbers of lappet-faced and other vultures continue to decline. They are wide-ranging and require engagement and action across many countries. If poisoning is not urgently and decisively addressed, southern Africa risks losing much of its vulture guild within a single human generation, with profound ecological and social consequences.
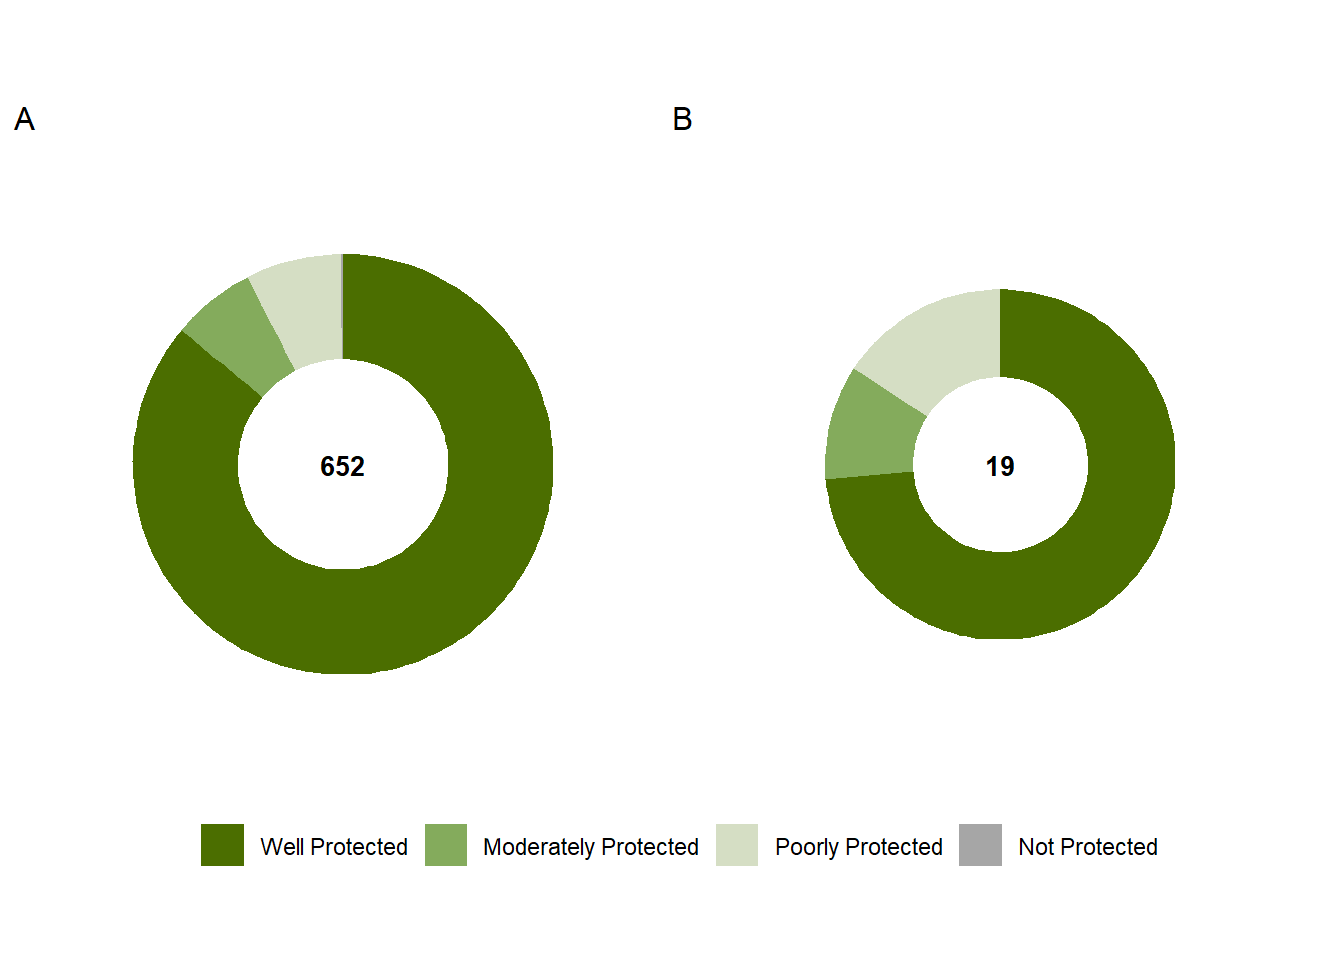
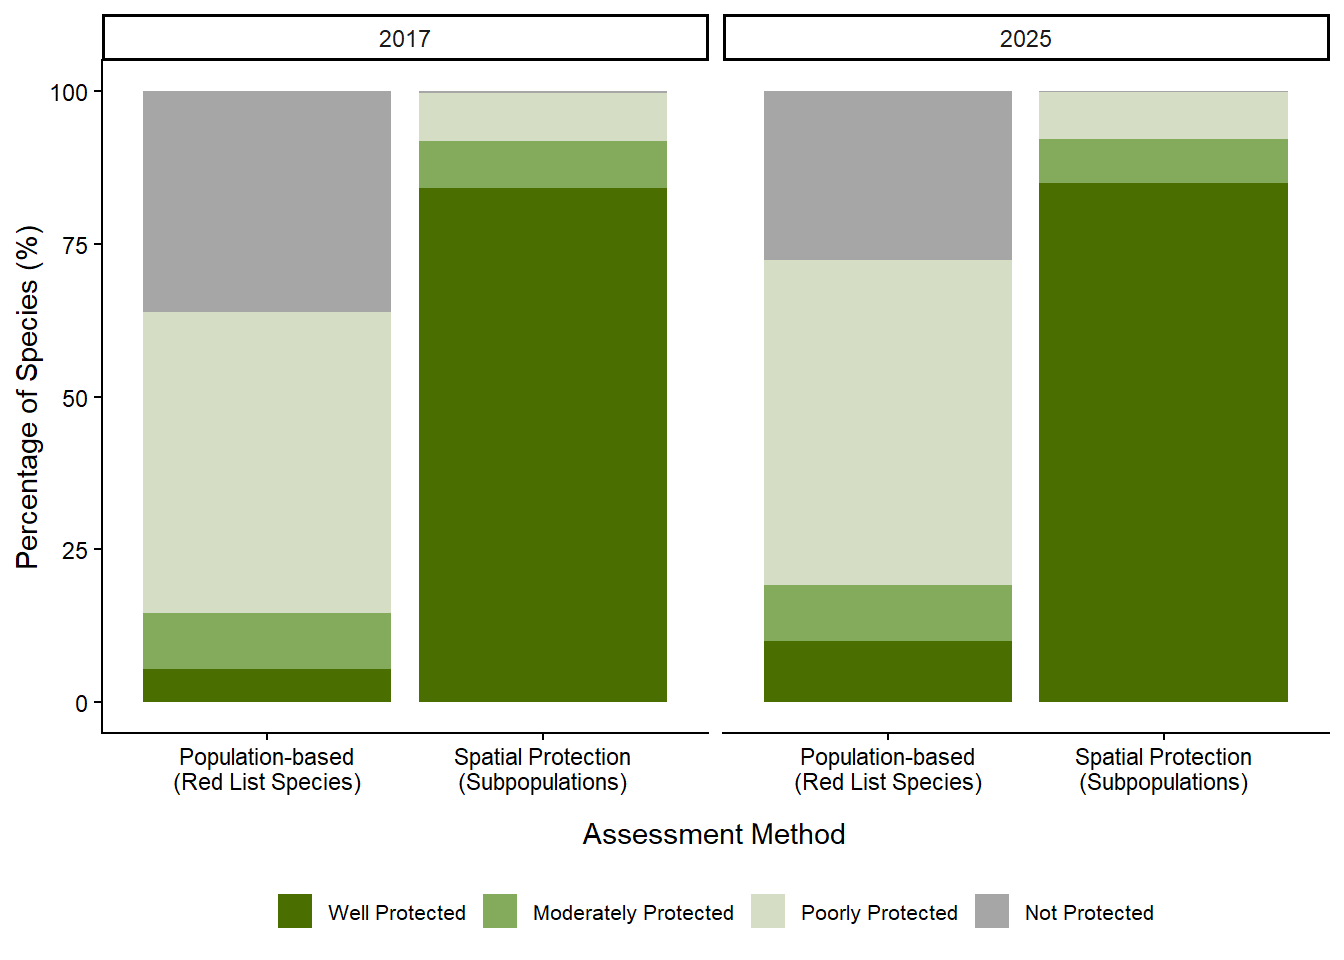
Protection level
To measure protection level, BirdLife South Africa applied two complementary approaches: a subpopulation-based method covering 652 terrestrial bird species, and a population-based method applied to a subset of 130 birds that had available abundance estimates (see approach section). The subpopulation approach confirms that most birds are spatially well represented within the protected area network, with over 84% classified as Well Protected in both 2017 (84.1%) and 2025 (84.9%), in broad agreement with the study on measuring protection effectiveness for terrestrial bird species in protected areas and OECMs in South Africa5. Between 2017 and 2025, mean protection level scores increased from 7.50 (±0.32 SE) to 8.53 (±0.35 SE), representing a 13.7% increase, although only nine species (1.3%) showed improved protection categories between assessment periods – most gains were for species of low conservation concern.
The population-based analysis paints a more sobering picture, revealing that only 10% of threatened species meet minimum viable population thresholds inside protected areas. However, there was a positive movement to improved category status from 2017 to 2025: 123 of the 130 Red List species did not reach the Well Protected category in 2017, compared to 117 for 2025, representing an improvement of 4.6%. Together, these results highlight both the conservation value of South Africa’s protected areas and the gaps that remain, particularly for threatened, range-restricted, and habitat-dependent species that require targeted expansion and improved management of the network6.
Species recovery
Despite South Africa’s extensive protected area network, many bird species remain at high risk of extinction because they face pressures that persist even when habitat is nominally safeguarded. Large birds, including vultures and storks, are prime examples. Recovery interventions are therefore essential to prevent imminent extinctions and to reverse long-term declines. Birds requiring recovery action tend to fall into three groups: (1) highly range-restricted endemics whose tiny populations are declining faster than habitat loss alone can explain; (2) species exposed to direct anthropogenic pressures such as poisoning, fisheries interactions, or collisions with energy infrastructure; and (3) island or seabird populations threatened by invasive predators at breeding sites.
Priority areas for bird recovery are guided by the 2025 Red List assessments and subsequent expert consultations. These processes identified species whose continued declines are unlikely to be halted by protected area coverage alone, and which therefore require targeted interventions. While the expansion of protected and conserved areas under Global Biodiversity Framework (GBF) Target 3 is essential, recovery planning shows that protection alone is insufficient unless paired with targeted species-focused measures. Where published prioritisation exists, such as the Biodiversity Management Plan for Vultures4 or the Mouse-Free Marion Project plans, these form the basis for coordinated action. In other cases, BirdLife South Africa and partners use a combination of Red List urgency, ecological feasibility, and opportunity for partnerships with landowners or government to determine priorities.
Selected active recovery projects are highlighted below (Table 3). This showcases both the diversity of interventions needed and the scale of resources required. Some species, such as Botha’s lark, require stewardship agreements and changes in land-use practices to secure remnant grassland habitat. Others, such as the blue swallow, need artificial nest-site provisioning and alien clearing in addition to site protection. For marine birds such as the African penguin, population recovery hinges on fisheries reform, fishery closures around key colonies, and advocacy on threats such as ship-to-ship bunkering (see further marine bird results here).
Several threatened vultures (white-backed, lappet-faced, hooded and white-headed vultures) require landscape-scale pressure reduction, including poison-response networks, regulation of traditional medicine markets, a change in the hunting culture preference for lead-based ammunition, and mitigation of electrocution and collision risks. In contrast, the bearded vulture recovery strategy combines in situ action with a long-term ex situ programme Bearded Vulture Captive Breeding Project, where harvested eggs are raised in captivity and juveniles reintroduced.
Species like the black harrier highlight the urgent need for collision mitigation at wind energy facilities, given population viability models showing extreme sensitivity to adult mortality.
On Marion Island, a suite of seabird species (including albatrosses, petrels, and prions) are threatened by the invasive house mouse (Mus musculus), which predate on chicks and even adults. Without eradication, local extinctions are predicted within a century. The Mouse-Free Marion Project budgeted at over R560 million, represents the largest single bird recovery initiative underway in southern Africa. See marine bird page for further details.
Collectively, these examples illustrate that recovery work is expensive and long-term, with estimated costs for the next five years exceeding R695 million and current funding falling short by hundreds of millions. While interventions are in place for many species, most require upscaling if they are to prevent extinctions. Success will depend on strong partnerships among government, NGOs, researchers, landowners, and local communities, and on mobilising significant new resources to match the scale of the challenge, in alignment with global commitments such as GBF Target 3 (expansion and effective management of protected areas) and GBF Target 4 (halting species extinctions and promoting recovery).
| Species | Status | Key Recovery Needs | Current Interventions |
|---|---|---|---|
| Botha’s lark | CR | Stewardship outside reserves; research into grazing impacts | Stewardship and landowner engagement (BLSA, EWT) |
| Blue swallow | CR | Stewardship; artificial burrows; alien clearing | Stewardship and monitoring (BLSA, Conservation Outcomes) |
| White-backed vulture | CR | Landscape-level poisoning prevention; population supplementation | EWT Vultures for Africa; BLSA lead ammo awareness |
| Lappet-faced vulture | CR | Landscape-level poisoning prevention; population supplementation | EWT Vultures for Africa; poisoning intervention |
| Hooded vulture | CR | Habitat protection; poisoning prevention | EWT Vultures for Africa; habitat and poisoning response |
| Bearded vulture | CR | Captive breeding programme with egg harvesting; threat mitigation | Bearded Vulture Task Force, Bred-for-the-Wild project |
| African penguin | EN | Fishery closures; colony stewardship; advocacy | Colony management, BMP-S, new De Hoop colony, advocacy |
| Bank cormorant | EN | Research; colony stewardship | Linked to African Penguin work |
| Cape gannet | EN | Colony stewardship; foraging management | Linked to African Penguin work |
| White-headed vulture | EN | Landscape-level poisoning prevention; population supplementation | EWT Vultures for Africa; poisoning intervention |
| Black harrier | EN | Collision mitigation at wind farms; habitat protection | Research and advocacy on renewable energy impacts |
| Marion island breeding spp | Varies | Eradication of invasive mice at Marion Island | Mouse-Free Marion Project (BLSA, DFFE) |
Knowledge gaps
While many long-standing pressures on South Africa’s birds are well recognised, a number of emerging threats and uncertainties require research attention. Addressing these gaps will require both targeted research and systematic integration of new pressures into future Red List and protection level assessments. Improved data on novel threats, particularly energy infrastructure, agrochemical exposure, and marine resource exploitation, will strengthen conservation planning and ensure that the National Biodiversity Assessment reflects the full scope of pressures shaping South Africa’s bird life.
Agriculture and expansion of croplands continue to be linked to biodiversity loss, however changes in agricultural practices are anticipated to introduce new and as yet poorly understood dynamics. For example, the rapid expansion of shaded agriculture, where fruit orchards are increasingly sealed under large greenhouse structures will likely have negative impacts on avian biodiversity. These structures prevent access to flowering trees by natural pollinators and may have cascading impacts on terrestrial biodiversity. Parallel to this, agrochemical use has grown substantially, yet its full impact on South African birds and other wildlife is poorly understood. In addition, the spread of novel crops, including genetically modified organisms introduced into new habitats, raises questions about long-term ecosystem impacts.
Climate change represents a cross-cutting pressure where biodiversity impacts remain poorly quantified at the species level. Although broad projections suggest range contractions and distribution shifts for many species, very few South African birds have been assessed using bespoke best-practice models that integrate climatic, habitat and demographic data. This leaves uncertainty about which species are most vulnerable, the likely magnitude of impacts, and where conservation interventions should be prioritised. Incorporating climate velocity, dispersal capacity, and habitat quality into future assessments will be essential to identify both high-risk species and potential refugia.
Energy demand is another fast-moving frontier. The growth of cryptocurrency mining and AI technologies is driving global electricity consumption, yet the scale and consequences for South Africa remain largely unquantified. At the same time, renewable energy developments, particularly the rapid roll-out of wind energy projects in Mpumalanga and along the coast, pose escalating risks for birds and bats. Offshore wind energy generation is also emerging as a potential future pressure on marine biodiversity.
New biological challenges are also evident. The proliferation of novel diseases, often exacerbated by climate change and land-use shifts, poses unknown risks to terrestrial bird populations. Examples of land-use shifts include bush encroachment in the karoo, grasslands and savannas, inappropriate fire regimes, and habitat fragmentation. These changes continue to alter habitat quality for specialist species. Illegal ploughing and clearing of natural habitats remain a widespread challenge, often circumventing environmental impact assessments.
Marine and coastal systems face their own suite of emerging pressures. Sardine stocks remain depleted, yet sardines are a keystone prey resource for seabirds and other predators. Current operational management procedures inadequately account for ecosystem needs. Coastal aquaculture, including reliance on fishmeal and bonemeal inputs, has ecological knock-on effects that are poorly quantified. Sand mining is expanding along the coast, threatening coastal biodiversity. Meanwhile, ship-to-ship bunkering operations, paused off Algoa Bay but likely to increase elsewhere, introduce additional risks of oil spills, noise pollution, and chronic disturbance in sensitive seabird areas. See more on the marine bird page.
Approach
Threat status assessment
The regional conservation assessment for the birds of South Africa, Lesotho, and Eswatini was conducted by BirdLife South Africa with contributions from 138 species experts. It was initiated in late 2021, and assessments concluded at the start of 2025. This assessment builds upon the 2015 Eskom Red Data Book findings. All of Southern Africa’s non-vagrant species were assessed for signs of decline using citizen science datasets such as SABAP2, CWAC and CAR7.
Species deemed vagrants or introduced to the assessment region were excluded. At least 5% of a species’ global population or distribution needed to fall within the region to qualify for an assessment. We used BirdLife South Africa’s checklist of South Africa’s birds for 2023 as a starting point. This lists 876 species, but 123 were vagrant and 10 introduced. The taxonomy followed is that of the IOC World Bird List8. During 2023, a focus was on assessing seabird species, for which there are few public datasets available, and where assessments rely heavily on expert knowledge. In 2023, a comprehensive synthesis of citizen science datasets for terrestrial (including freshwater) bird species was undertaken and these datasets fed the 2024 assessments of terrestrial and freshwater birds7 6. The thresholds and methods follow IUCN Global and Regional Red List guidelines and take into account new data on distribution, population trends, and known threats (IUCN Red Listing process summary here).
See details about how the IUCN Red List assessments are conducted here.
Pressure analysis
Pressures on bird populations were assessed using the standardised IUCN Threats Classification Scheme (v3.3). For each of the 147 bird species assessed as Critically Endangered, Endangered, Vulnerable or Near Threatened, all relevant sub-threats were coded during the 2025 regional Red List process, resulting in multiple records per species where more than one pressure operates. Each record represents a unique species–sub-threat combination. For example, a species such as Botha’s lark may have separate entries for habitat loss from annual cropping, overgrazing, bush encroachment, and altered fire regimes, with each coded as a distinct record. For reporting here, sub-threats were then aggregated into the eleven major IUCN threat categories to quantify the frequency with which each pressure affects a species. Because species often face several pressures simultaneously, threat categories are non-exclusive and percentages do not sum to 100%. Species were also assigned to non-exclusive ecological realms to allow realm-specific summaries of threat patterns: 80 terrestrial, 35 inland aquatic, 24 estuarine/coastal, and 41 marine species. These realm designations reflect ecological rather than taxonomic divisions, and species occurring across multiple realms were counted in each relevant group. For instance, great white pelican is both inland aquatic and marine. Threat frequencies were summarised using distinct species-level records within each realm to avoid double-counting of sub-threats.
Protection level assessment
The species protection level assessment measures the contribution of South Africa’s protected area network to species persistence. It evaluates progress towards the protection of a population target for each species, set at the level of protection needed to support long-term population survival.
Read more about the calculation of the protection level indicator here.
BirdLife South Africa first piloted a species-level Protection Level (PL) metric in 2017, measuring the number of viable bird subpopulations occurring in well-managed protected areas5. Species occurring in >20 protected areas were deemed to be well protected. The method was refined for the current National Biodiversity Assessment using improved spatial data, updated land-cover information, and a cluster-based definition of subpopulations, with >10 subpopulations required in protected area clusters. This framework allows a systematic comparison between 2017 and 2025, providing an evidence-based measure of how effectively the protected area network supports the long-term persistence of South Africa’s avifauna6.
Technical documentation
Data sources
Barnes, K. N. (Ed.). 2000. The Eskom Red Data book of birds of South Africa, Lesotho and Swaziland. Johannesburg, South Africa: BirdLife South Africa.
Lee, A. T. K., Rose, S., Banda, S., Bezeng, S. B., Maphalala, M. I., Maphisa, D. H., & Smit-Robinson, H. A. (Eds.). 2025. The 2025 Red Data Book of birds of South Africa, Lesotho and Eswatini. Johannesburg, South Africa: BirdLife South Africa.
DFFE. 2024. South African Protected Areas Database (SAPAD), Version 2024_Q3 (modified by SANBI). DFFE, Pretoria. Available at: https://www.dffe.gov.za/egis. Accessed: 25 August 2024.
Acknowledgements
| Contributor | Affiliation |
|---|---|
| Hanneline Smit-Robinson | Birdlife South Africa |
| Chris Kelly | Wildlife ACT |
| Anisha Dayaram | South African National Biodiveristy Institute |
| Carol Poole | South African National Biodiveristy Institute |
Recommended citation
Lee, A., Smith, D.E., Raimondo, D.C., Van Der Colff, D., Hendricks, S.E., Lloyd, K., & Monyeki, M.S. 2026. Birds. National Biodiversity Assessment 2025. South African National Biodiversity Institute. http://nba.sanbi.org.za/.
References
1. Butchart, S.H.M. et al. 2004. Measuring global trends in the status of biodiversity: Red List indices for birds. PLoS Biology 2: https://doi.org/10.1371/journal.pbio.0020383
2. Colyn, R. 2025. Botha’s lark. In Lee, A.T.K. et al. (eds), The 2025 Red Data book of birds of South Africa, Lesotho and Eswatini BirdLife South Africa, Johannesburg, South Africa.
3. Botha, A.J. et al. 2017. Multi-species action plan to conserve African-eurasian vultures.
4. DFFE. 2024. Public notice for the national vulture multi-species biodiversity management plan (BMP). National environmental management: Biodiversity act, 2004 (act 10 of 2004), government notice 4517. Government Gazette 50306: 3–128.
5. Retief, E. & D. Marnewick. 2017. Measuring protection effectiveness for terrestrial bird species in protected areas and OECMs in South Africa: Proposed metrics (Draft 6). BirdLife South Africa, Johannesburg, South Africa.
6. Lee, A.T.K. & D.A. Ehlers-Smith. 2025. Measuring protection effectiveness for terrestrial bird species in protected areas in South Africa. BirdLife South Africa, Johannesburg, South Africa.
7. Brooks, M. et al. 2022. The African Bird Atlas Project: A description of the project and BirdMap data-collection protocol. Ostrich 93: 223–232. https://doi.org/10.2989/00306525.2022.2125097
8. Gill, F. et al. (eds). 2025. IOC world bird list (v15.1).
Notes
The percentage values in this section indicate the percentage of threatened and Near Threatened bird species impacted by the listed pressures.↩︎