South Africa uses the IUCN Red List of Threatened Species Categories and Criteria to assess species’ risk of extinction. This system is the international standard for reporting on the status of biodiversity in multilateral environmental agreements such as Target 4 of the Convention on Biological Diversity’s Kunming-Montreal Global Biodiversity Framework.
Threat categories
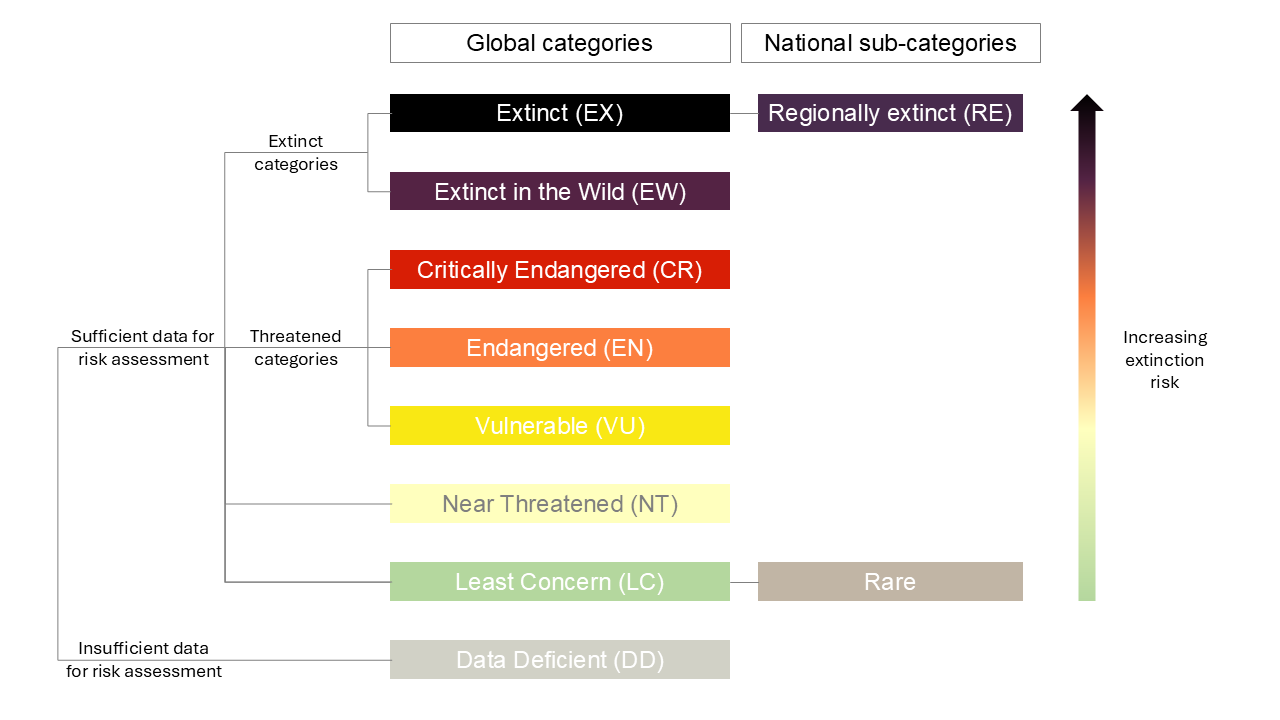
The system uses quantitative criteria to assign species to categories indicating relative risk of extinction, from Least Concern (low risk of extinction) to Critically Endangered (highest risk of extinction). The criteria are based on scientific evidence of factors influencing risk of extinction across all species, except micro-organisms1. It is designed to be applicable under various levels of data quality and uncertainty, but species can also be classified as Data Deficient when they are too poorly known to determine their risk of extinction. Species classified as Critically Endangered, Endangered, and Vulnerable are collectively referred to as threatened species.
Species are classified as Extinct only when there is no reasonable doubt that there are no remaining living individuals of the species, with the aim to avoid erroneous classifications that may lead to the withdrawal of conservation efforts. Some Critically Endangered species are tagged “possibly extinct”. This tag is used to highlight species that are suspected to be extinct, but the strong evidence required to confirm extinction is not yet available. Species that remain only in cultivation or captivity are classified as Extinct in the Wild.
For most South African species assessments apply only to the parts of a species’ range within the borders of South Africa and its exclusive economic zone (EEZ), the region of ocean that extends 200 nautical miles from the coast. For species that are not endemic to South Africa, in other words, their distribution extends beyond the borders of South Africa or the EEZ, the IUCN’s regional assessment procedures are applied. An exception is made for species with only a very small proportion (<5%) of their global range inside South Africa, where the species’ global status is adopted as the national status. This avoids potential over-inflation of threatened species lists with species that may have restricted distributions in South Africa, putting them at higher potential risk of local extinction, while they are widespread and not at risk of extinction outside South Africa.
The use of regional assessment methods introduces an additional national sub-category of extinction, Regionally Extinct (RE), which indicates species that are extinct within South Africa, but may persist elsewhere outside the country. Some taxonomic groups choose to distinguish species that are at low risk of extinction (Least Concern), but have narrow distribution ranges (typically less than 500 km2) in the national sub-category Rare. These species are considered national conservation priorities despite their classification as Least Concern under the IUCN system.
South Africa’s Species Threat Status indicator therefore reports the proportion of species in each of 10 national threat categories (Figure 1).
National species assessments
Taxon expert working groups are responsible for national Red List assessments, with the work being co-ordinated by SANBI’s Threatened Species Unit and the IUCN SCC South Africa Species Specialist Group. IUCN Red List criteria is typically applied to all indigenous species in a taxon group, not just those that are suspected to be in danger of extinction. Incomplete or selective assessments may present a biased view of the state of biodiversity, and could result in inappropriate allocation of scarce conservation resources, and even undetected extinctions3,4.
A key feature of biodiversity reporting is measuring how species’ risk of extinction change over time, as a means of detecting whether targets to avoid species extinctions are being met. Tracking trends in risk of extinction requires regular reassessments of species’ risk of extinction, which can be challenging in highly speciose groups such as plants. For such groups, an alternative approach is to take a random sample of species from national checklists of indigenous species, and focus more regular reassessment efforts on the selected species. The statistical assumption is that because the sample is random, trends in extinction risk in the sampled species is representative of true trends in the taxon group5. When sampling, South Africa follows the recommended sample size of 900 species6.
National Red List assessments for animals are reported on SANBI’s Red List of South African species website, while assessments for plants can be found at the Red List of South African plants website.
Red List Index of species
The Red List Index of species (RLI) combines the risk of extinction of all species in a comprehensively assessed taxon group or a representative sample into a single statistic that can be used to track changes in species’ risk of extinction over time. The index follows a process of retrospectively adjusting species’ assessments at earlier time points so that only genuine changes in extinction risk are included in the index7.
The index value ranges from 0 to 1. Values closer to 0 indicate higher proportions of species at high risk of extinction, with 0 reached when all species are extinct. Values closer to 1 indicate higher proportions of species at low risk of extinction, with all species being Least Concern resulting in an index value of 1. The slope of the line between time points indicate how fast species are moving towards extinction (negative trends) or recovering (positive trends), with steeper lines indicating faster decline or recovery. Strong negative changes in the slope of the index are indicative of rapidly emerging pressures on species that require urgent action.
South Africa uses species’ national Red List status when calculating the national RLI, rather than the global disaggregation method of area-weighted adjustments to species’ global Red List status8. This method is preferred because South Africa invests significant efforts into species conservation, resulting in some species assessed nationally at a lower risk of extinction than their global assessments.
The RLI is calculated by applying weights to Red List categories in increasing order of risk of extinction, from 0 for Least Concern, to 5 for Extinct/Extinct in the Wild. The number of species in each category is multiplied by the category weight, and these values are summed. This value is compared to a maximum value where all species would be extinct. Data Deficient species are excluded from the index calculation, but used to inform the confidence intervals of the indicator value7. More Data Deficient species means larger uncertainty around the indicator value.
The formula for calculating the RLI is as follows:
\[ RLI_t = 1 - \frac{\displaystyle\sum_s W_{c(t,s)}}{W_{EX} \cdot N} \] where:
- Wc(t,s) is the weight for threat category c at time t for species s
- WEX is the weight for the Extinct category
- N is the number of species assessed, excluding those that are Data Deficient