
17%
of 900
representative taxa
assessed
Threatened
of 900
representative taxa
assessed
Threatened
70%
of 900
representative taxa
assessed
Well Protected
of 900
representative taxa
assessed
Well Protected
14%
of 900
representative taxa
assessed
Not Protected
of 900
representative taxa
assessed
Not Protected
Key findings
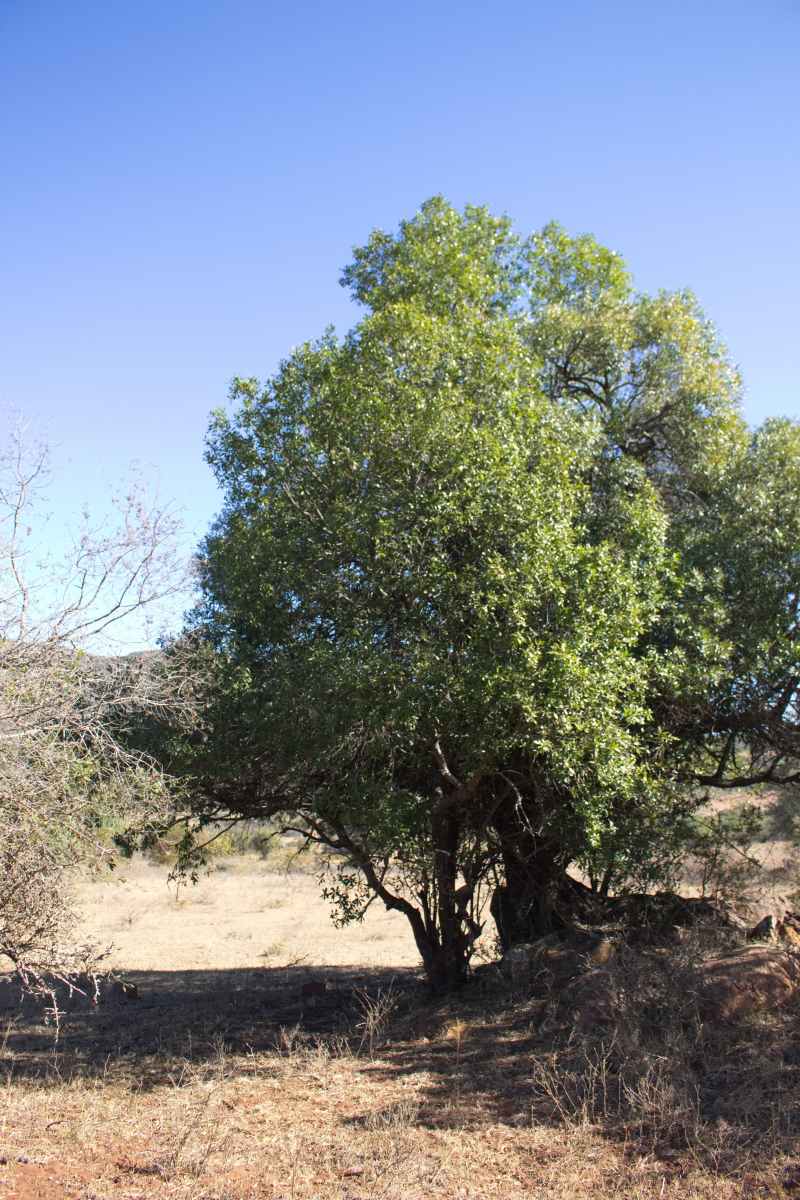
South Africa’s indigenous flora has high levels of diversity and endemism: 13 642 of the 20 248 taxa (67%) are endemic, with a high concentration of endemism in the south-western region of the Fynbos biome, and moderate concentrations in the arid regions, low escarpment bushveld, and coastal grasslands.
1 in 5 endemic plants are at risk of extinction.
Trends in threat status reveal a 2% increase in the number of plants at risk of extinction between 2017 and 2024. Increases in risk of extinction are driven mainly by habitat loss, competition with invasive alien species, illegal harvesting, and the intensifying impacts of climate change.
Protected area expansion has improved the protection of indigenous plants, but shortcomings in protected area effectiveness are constraining progress towards plant conservation targets.
Threat status
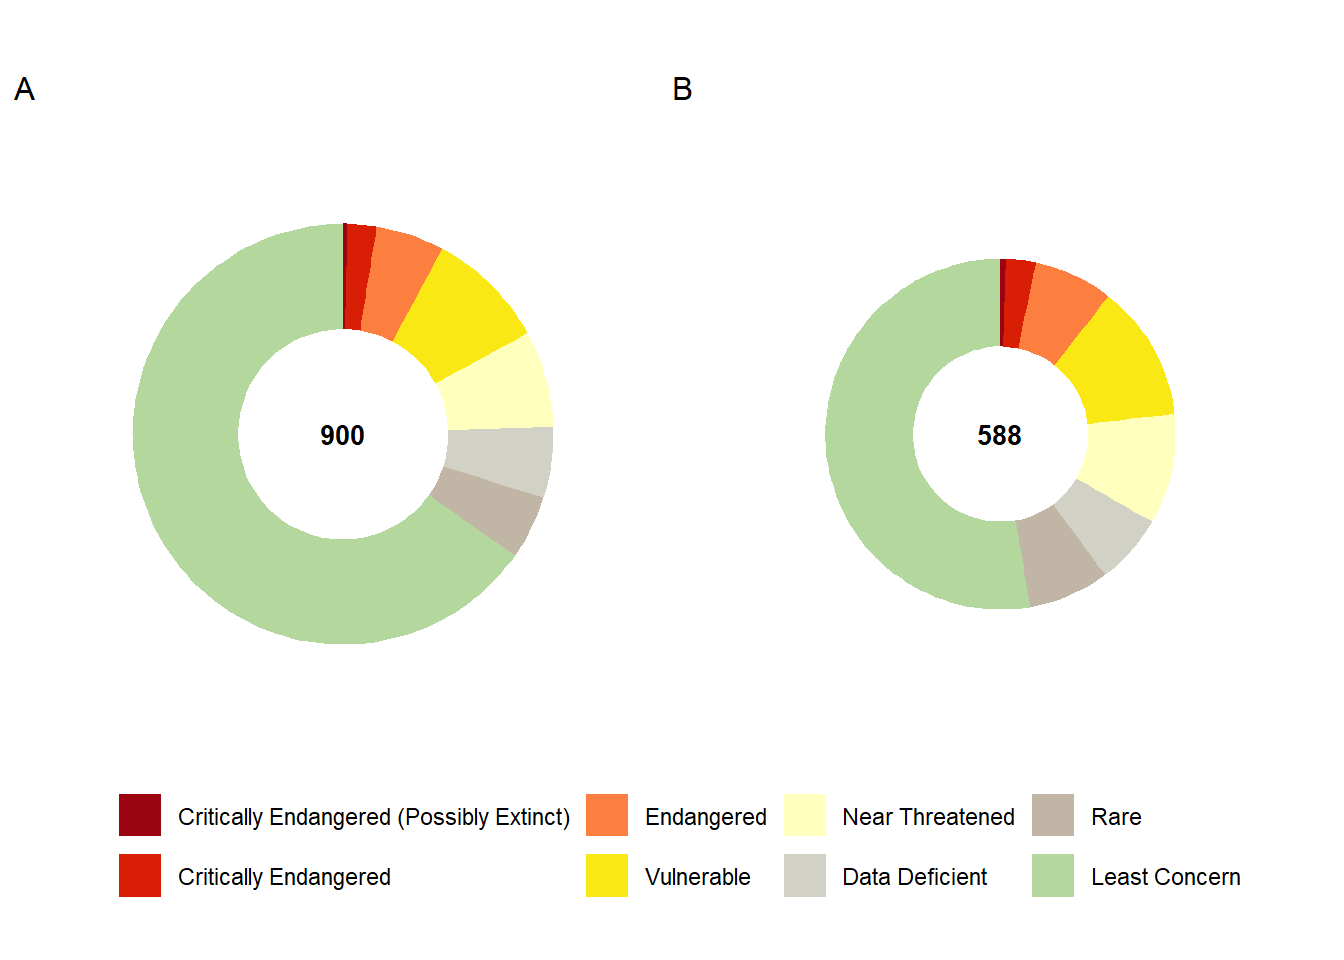
South Africa is maintaining a comprehensive national assessment of the threat status of 20 248 indigenous plants. The national plant Red List uses the IUCN Red List of Threatened Species Categories and Criteria, which measures a species’ risk of extinction within South Africa. The Red List includes several extinct categories, three threatened categories - Critically Endangered (CR), Endangered (EN), and Vulnerable (VU) - as well as categories for Near Threatened (NT), Data Deficient (DD), and Least Concern (LC). South Africa augments the IUCN system by adding a category for rarity (Rare), defined as range-restricted endemic species with a global extent of occurrence of less than 500 km² that occur in areas with no significant anthropogenic pressures. Rare species are prioritised for national conservation interventions, even if they qualify as Least Concern under the IUCN system.
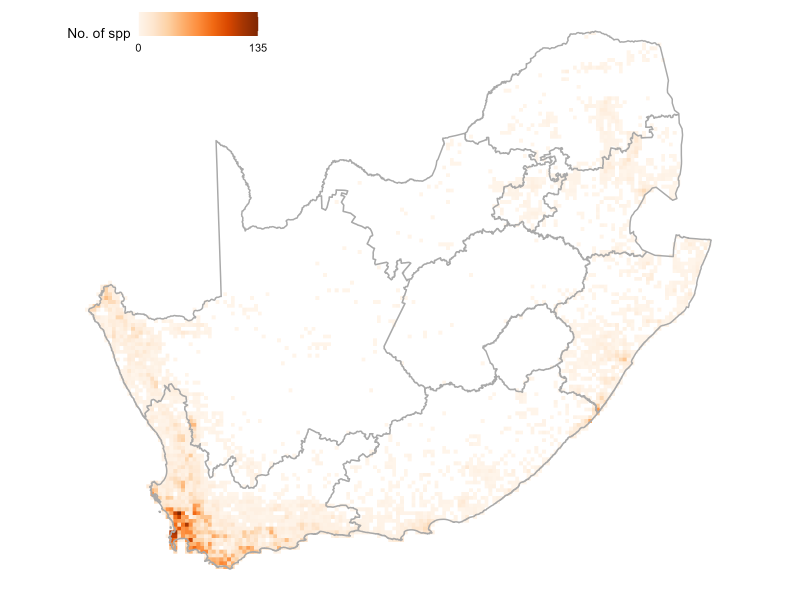
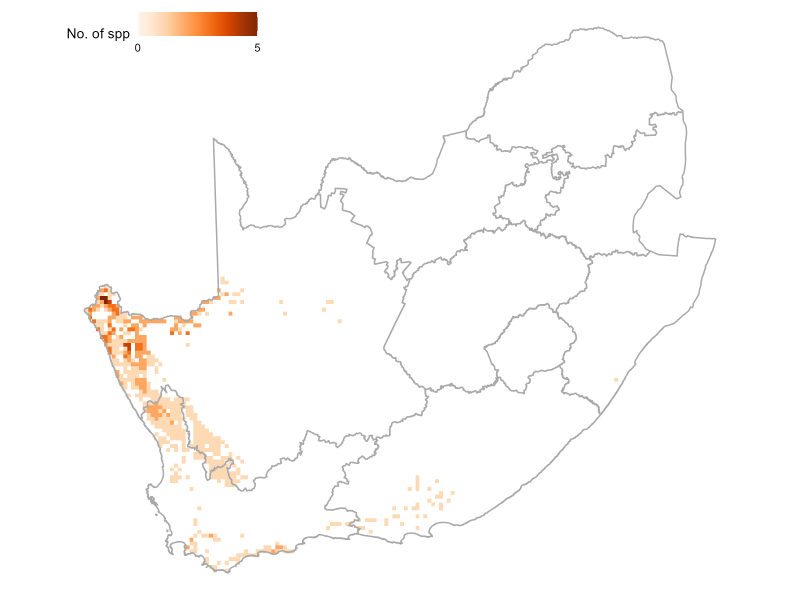
Overall, 16% (3 195 taxa) of the indigenous flora is threatened, while 36 taxa (0.2%) are extinct or possibly extinct. Threatened plants are concentrated in the the Cape Floristic Region, the Succulent Karoo and the eastern escarpment (Figure 1). South Africa also has high levels of plant endemism, with 13 648 taxa (67%) found only in South Africa.
Given the exceptional diversity and high levels of threat, monitoring and reassessing all plant species regularly is not feasible. The Red List team prioritises specific plant families or genera to assess each year. To track trends in extinction risk and identify the pressures driving these risks, a representative sample of 900 plant species is reassessed regularly for National Biodiversity Assessment. Of the assessed representative plants, 17% taxa are threatened with extinction (Figure 2). This slightly higher statistic likely reflects the actual threat level to plants, as newly updated assessments reflect major recent increases in pressures on plants such as climate change and illegal collection of wild plants for ornamental purposes. These assessments also more accurately represent intensifying pressures such as habitat loss to mining and the spread of invasive alien plants.
| Taxon | Extinct | Extinct in the Wild | Critically Endangered | Critically Endangered (Possibly Extinct) | Endangered | Vulnerable | Near Threatened | Data Deficient | Rare | Least Concern | Total |
|---|---|---|---|---|---|---|---|---|---|---|---|
| Representative sample taxa* | 0 | 0 | 20 | 3 | 47 | 83 | 67 | 49 | 44 | 587 | 900 |
| Representative endemic taxa* | 0 | 0 | 16 | 3 | 43 | 74 | 60 | 38 | 44 | 310 | 588 |
| All plant taxa | 28 | 8 | 538 | 71 | 1027 | 1559 | 600 | 1367 | 1318 | 13732 | 20248 |
| Endemic plant taxa | 28 | 7 | 476 | 70 | 969 | 1474 | 540 | 1272 | 1270 | 7542 | 13648 |
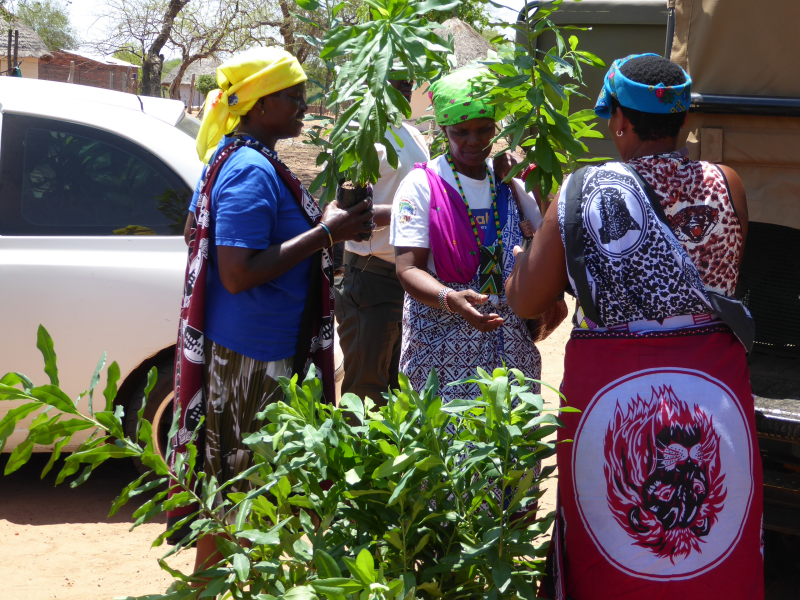
NoteBox 1. Conservation interventions for medicinal plants reversing extinction risk trends – a case study of Warburgia salutaris
A pioneering socio-ecological conservation model developed in the Kruger National Park and spread to other parts of South Africa, has successfully resulted in the highly popular medicinal plant the pepper bark tree (Warburgia salutaris) being downlisted from Endangered to Vulnerable. This conservation intervention that supplies traditional healers with cultivated plants to grow in home gardens has reduced pressure on wild populations while ensuring continued access to culturally important resources. The intervention has slowed and reversed the species’ decline, leading to a genuine improvement in its Red List status. Building on this success, the model is now being expanded to other medicinal plant species, offering a replicable blueprint for balancing cultural practices with biodiversity conservation.
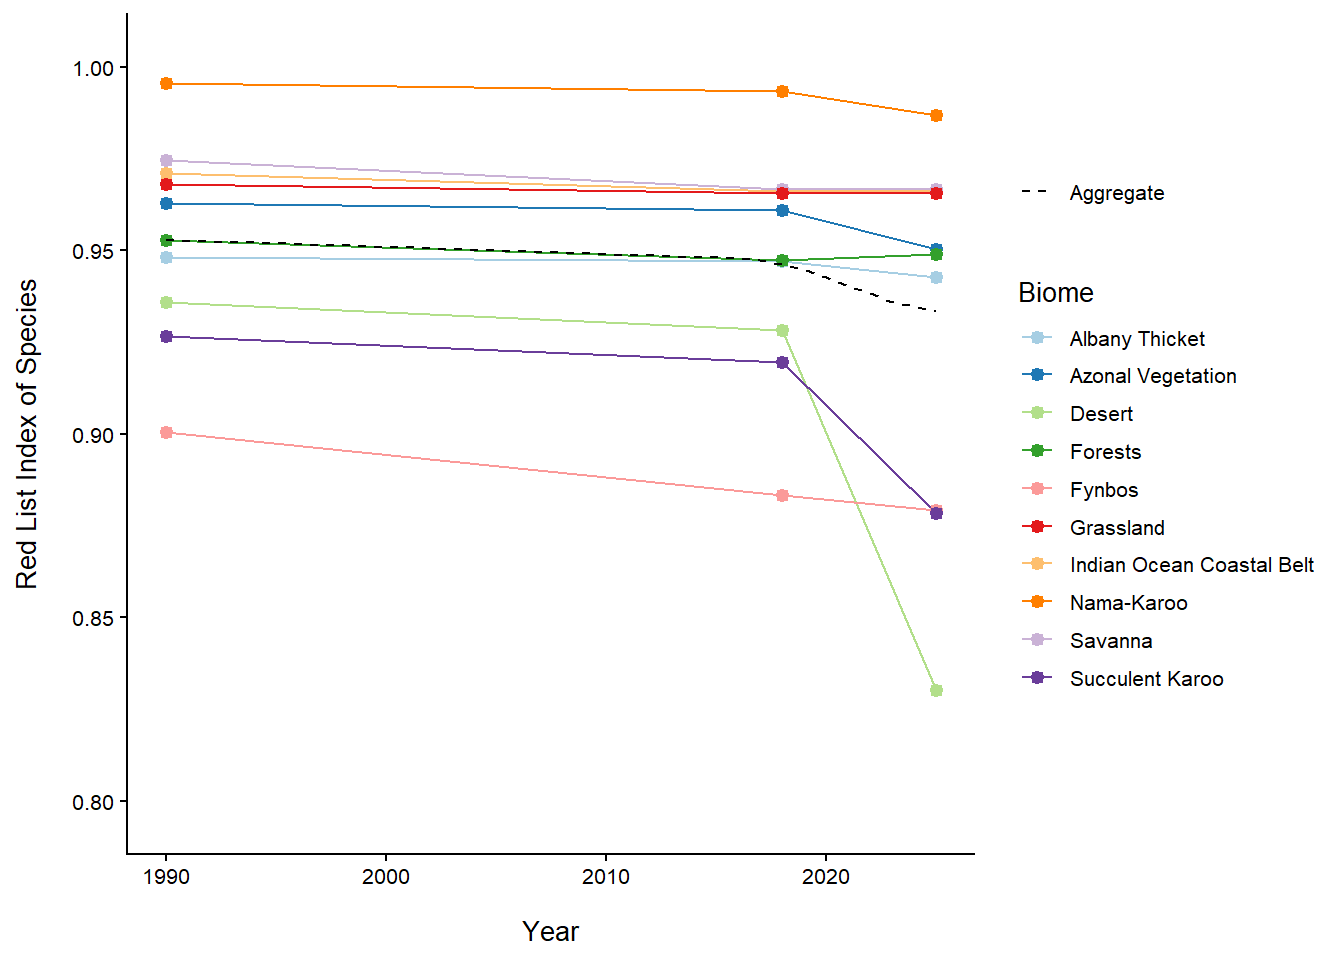
Trends – the Red List Index
The trend in species status over time was measured using the globally recognised indicator, the IUCN Red List Index of species (RLI)1. The RLI is calculated for specific taxonomic groups based on genuine changes in Red List status over time. The RLI value ranges from 0 to 1. At a value of 1, all species are at low risk of extinction (Least Concern), while a value of 0 indicates that all species are extinct. The Red List Index of plants is calculated using the representative sample of 900 taxa.
The RLI indicates a slow but consistent increase in the risk of extinction of plants. About 5% of sampled taxa became more threatened between 1990 and 2018, with a further 2% increase in threat between 2018 and 2024. Plants occurring in the Desert and Succulent Karoo biomes declined most rapidly between 2018 and 2024 (Figure 3) due to increasing pressures from climate change and habitat loss from mining and renewable energy developments. Most of these taxa occur in the Northern Cape. The province has experienced a prolonged drought over the past decade, which has exacerbated the effects of livestock overgrazing, mining, and renewable energy developments. This same region is also being heavily impacted by the illegal trade of ornamental succulent and geophytic plants (see Box 2). The RLI for plants in the Forest biome improved due to reduced habitat pressure from clearing invasive species and targeted conservation interventions (see Box 1).
| Taxon | Change in status (2018 to 2025) | Direction of change | Reason for change |
|---|---|---|---|
| Adromischus marianiae* | LC to NT | Increase | Competition from invasive alien species, illegal collection, and drought-related mortality are causing a decline in the population. |
| Aloe meyeri* | LC to CR | Increase | Prolonged drought conditions and ongoing aridification resulting from climate change have caused >70% mortality in subpopulations. |
| Amphibolia succulenta* | NT to EN | Increase | The population has declined by approximately 45% over the past two generations (30–40 years) due to prolonged droughts. An additional 10% decline is projected as a result of ongoing droughts and emerging threats, such as renewable energy development, which are expected to impact the area of occupancy. |
| Anacampseros albissima | LC to VU | Increase | The population is declining due to illegal collection. Emerging threats, such as renewable energy development, are projected to impact the area of occupancy. |
| Anisochaeta mikanioides* | LC to NT | Increase | Habitat disturbance and transformations due to the expansion of rural settlements and agricultural crop farming. |
| Arenifera pillansii* | EN to CR | Increase | Prolonged drought conditions and ongoing aridification resulting from climate change have resulted in >70% mortality in some subpopulations. |
| Argyroderma testiculare** | LC to NT | Increase | Potential threat of poaching, and species in this genus are highly sought after. |
| Aspalathus pinea subsp. caudata* | VU to EN | Increase | Habitat quality is declining due to the spread of alien invasive plants. |
| Astridia citrina* | EN to CR | Increase | Based on habitat loss to mining and the projected aridification of its range. |
| Babiana lineolata* | NT to VU | Increase | At least 10% of the population has been lost due to crop cultivation. |
| Centella thesioides* | VU to NT | Decrease | Alien clearing successfully improved the threat status. |
| Conophytum francoiseae* | VU to CR | Increase | The population is declining due to the illegal collection. |
| Conophytum irmae* | EN to CR | Increase | The population is declining due to the illegal collection. |
| Conophytum pellucidum subsp. saueri* | VU to CR | Increase | The population is declining due to the illegal collection. |
| Conophytum praesectum* | LC to EN | Increase | The population is declining due to the illegal collection. |
| Conophytum rugosum* | LC to EN | Increase | The population is declining due to the illegal collection. |
| Conophytum stevens-jonesianum* | LC to EN | Increase | The population is declining due to the illegal collection. |
| Crassula alstonii* | LC to NT | Increase | Loss of habitat from mining activities within its range and illegal collection. |
| Cyrtanthus herrei* | NT to VU | Increase | Loss of habitat from mining activities within its range and illegal collection. |
| Dahlgrenodendron natalense* | EN to VU | Decrease | Habitat quality has improved due to alien invasive clearing. |
| Ferraria schaeferi* | LC to EN | Increase | Loss of habitat from mining activities within its range, and the emerging threat (renewable energy development) is projected to affect the area of occupancy. |
| Haworthia wittebergensis* | LC to NT | Increase | The population is declining due to the illegal collection. |
| Hebenstretia dregei* | VU to EN | Increase | Increased threat due to competition from invasive alien plant species. |
| Jordaaniella uniflora* | NT to CR | Increase | Loss of habitat to mining and ongoing desertification exacerbated by climate change. |
| Leucadendron meridianum* | LC to NT | Increase | Loss of habitat due to coastal development and competition from invasive alien plant species. |
| Leucospermum oleifolium* | LC to NT | Increase | Increased threat due to competition from invasive alien plant species. |
| Lobelia ardisiandroides* | NT to VU | Increase | Increased threat due to competition from invasive alien plant species. |
| Manulea robusta ** | VU to CR | Increase | Severe droughts have caused an 80% population decline. |
| Mitrophyllum mitratum* | VU to EN | Increase | The population is declining due to the illegal collection. |
| Pelargonium acetosum* | LC to VU | Increase | Loss of habitat to urban expansion and crop fields |
| Pelargonium quarciticola* | LC to VU | Increase | The population is declining due to the illegal collection. |
| Phylica incurvata* | VU to EN | Increase | Subpopulations are severely fragmented, with additional pressures from competition with invasive alien plant species, fire exclusion, and overgrazing. |
| Portulacaria namaquensis* | LC to NT | Increase | Prolonged drought conditions and ongoing aridification resulting from climate change. |
| Psoralea trullata* | LC to NT | Increase | Increased threat due to competition from invasive alien plant species |
| Stipagrostis geminifolia* | NT to CR | Increase | The population is declining due to livestock grazing and mining activities. Emerging threat, such as renewable energy development, is projected to impact the area of occupancy further. |
| Trachyandra aridimontana* | EN to CR | Increase | The population declined by over 70% due to prolonged drought conditions, livestock overgrazing and trampling, as well as illegal collecting. |
| Warburgia salutaris* | EN to VU | Decrease | A successful conservation intervention model has reduced overharvesting, slowed the rate of population decline, and led to a genuine improvement in the species' conservation status. |
Pressures
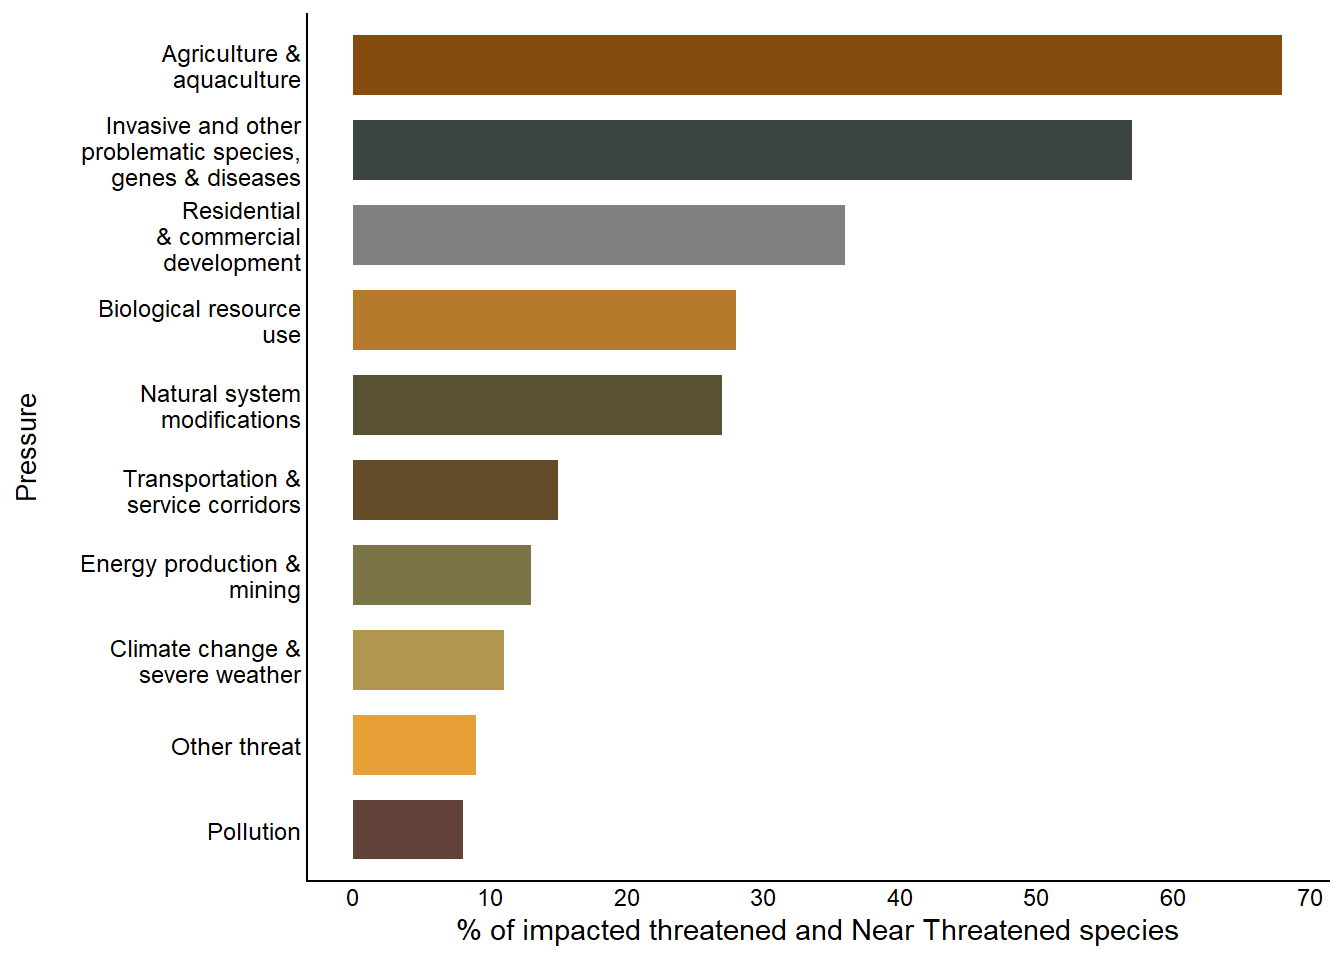
Plants in terrestrial ecosystems face multiple interacting pressures, including habitat loss and fragmentation, invasive alien species, pollution, unsustainable resource extraction, and climate change. Among these, habitat loss remains the most significant driver of species decline. Habitat loss is primarily caused by the conversion of natural vegetation for croplands, mining, plantations, human settlements, and infrastructure development. Habitat fragmentation further disrupts ecological functioning and reduces population viability, especially in the context of climate change and biological invasions.
Analyses of species that have increased their risk of extinction since 2021 reveal a notable shift in the primary drivers of extinction risk for plants. Before 2020, these risks were predominantly associated with competition from invasive species, agricultural expansion, urban development, and overgrazing by livestock2. However, current trends indicate increasing influences from climate change, illegal harvesting, mining, renewable energy projects and habitat degradation in sensitive arid ecosystems in the Northern Cape Province (Figure 4, Table 2). Agriculture, including crop cultivation and livestock farming, continues to affect the largest proportion of sampled plants (68%), while competition from invasive alien species is also severe (57%). Loss of habitat to residential and commercial developments has slowed since 2010; however, it still impacts 36% of plants. The 2018 National Biodiversity Assessment reported only 9% of plants to be threatened by harvesting; this has increased to 28%, and plants impacted by habitat loss to mining have increased from 8% in 2018 to 13% in this assessment. The influence of climate change and severe weather events was not reported to be impacting any of the sampled plants in 2018, but is now pronounced, affecting 11% of taxa (Figure 5).
NoteBox 2. Illegal trade in succulent plants
South Africa’s distinctive succulent diversity, notably those endemic to the globally significant Succulent Karoo biodiversity hotspot, is under increasing pressure from a dramatic surge in illegal harvesting driven by high international demand. Since 2017, 878 mostly localised endemic species have been affected by indiscriminate, unsustainable collection from the wild. Twelve species are now considered functionally extinct due to the majority of individual plants having been harvested from the wild.
The illegal succulent harvesting and trade crisis stems from multiple interconnected factors: a notable absence of cultivated material to meet global horticultural demand, limited economic opportunities in remote regions of the Northern Cape that make residents vulnerable to recruitment by criminal syndicates, inadequate in-situ protection measures across vast arid landscapes, and the proliferation of online trade platforms that facilitate operations. These pressures have been exacerbated by climate change impacts (including extended drought conditions since 2016), the COVID-19 pandemic’s socio-economic effects, and overwhelmed conservation authorities struggling with insufficient resources and capacity to manage the growing volume of confiscated plants requiring specialised care.
Recognising that initial law enforcement responses were unable to manage the full scale of the problem, the Department of Forestry, Fisheries and the Environment, in partnership with the South African National Biodiversity Institute and WWF South Africa, developed the comprehensive National Response Strategy and Action Plan in 2022 to address the illegal trade holistically through collaborative multi-stakeholder action. The strategy encompasses seven interconnected objectives designed to ensure both conservation outcomes and sustainable socio-economic development:
ensuring long-term survival of representative wild populations,
establishing well-managed ex-situ collections for confiscated specimens,
capacitating compliance and enforcement sectors with improved resources and coordination,
streamlining regulatory frameworks to support enforcement while enabling sustainable use,
reducing pressure on wild populations through community engagement and livelihood diversification,
developing effective communication strategies about the trade’s impacts, and
exploring options for a formal legal economy that benefits conservation and local development.
Each objective identifies specific actions, lead agencies, supporting partners, priorities, and timelines, with SANBI coordinating overall implementation through dedicated coordination positions established in 2023.
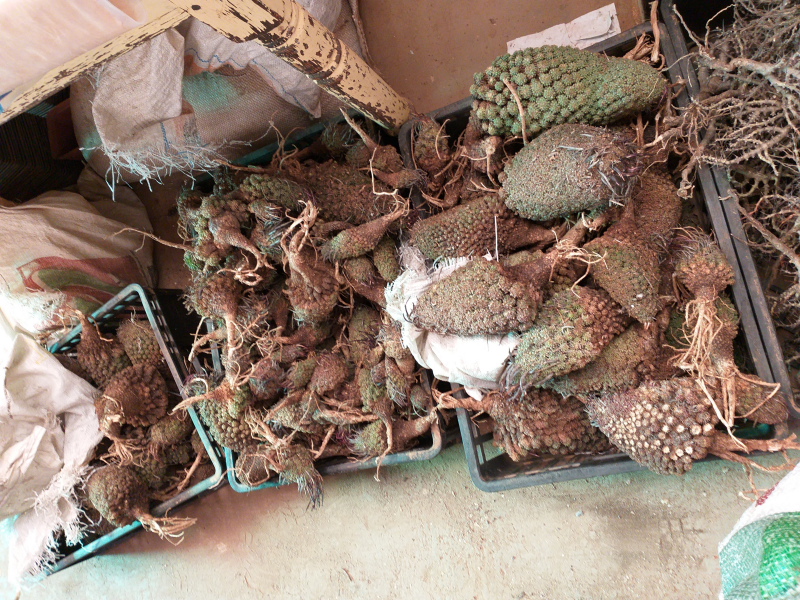
The trends in the illegal plant trade are constantly changing. Dwarf succulents from the family Aizoaceae originally dominated the trade, while geophytes and Euphorbia have become more popular recently. (© Carina Becker-Du Toit)
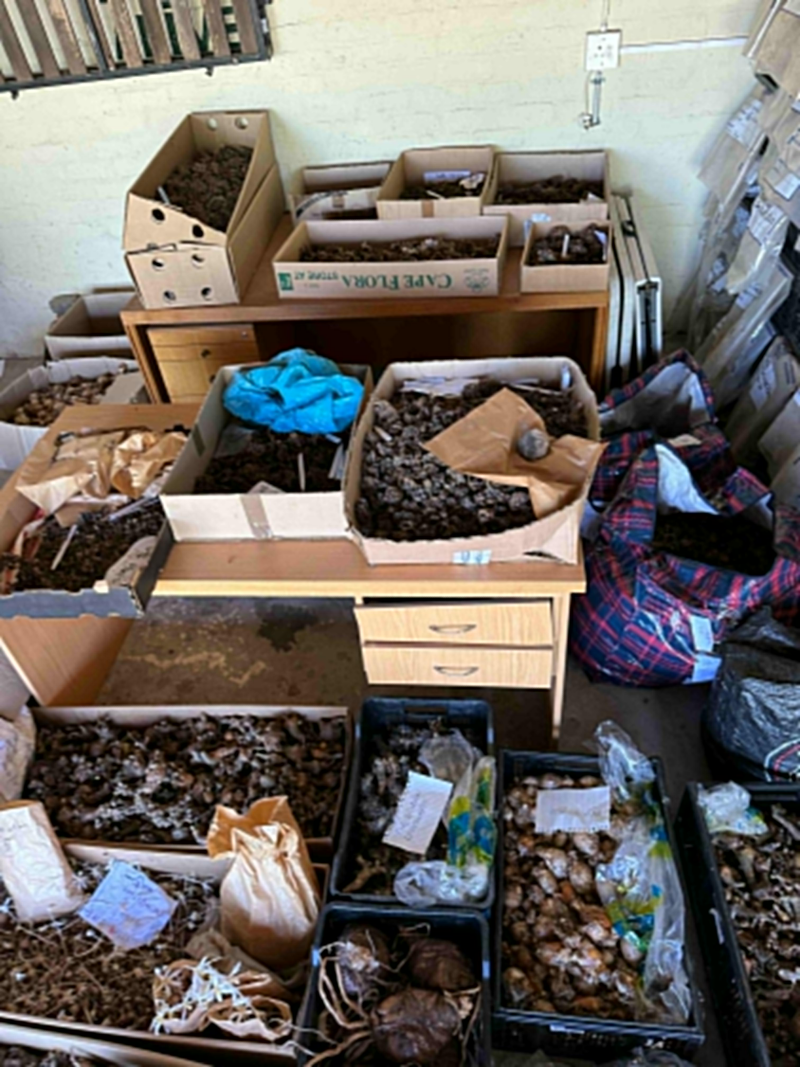
Staff taking care of confiscated succulents, in the hope of reintroduction in the future. (© Pieter van Wyk and Domitilla Raimondo)
Protection level
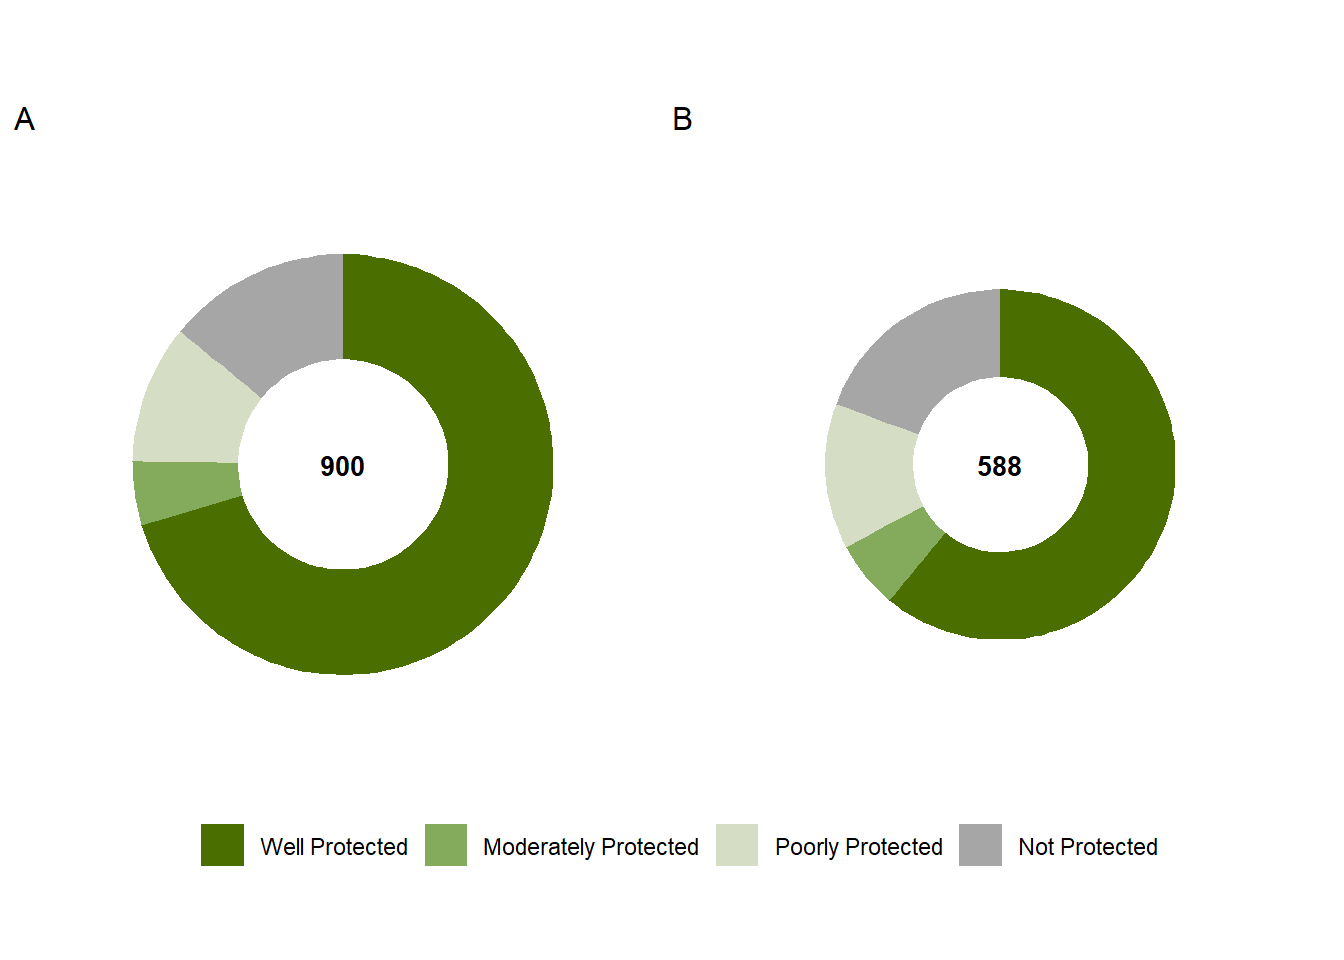
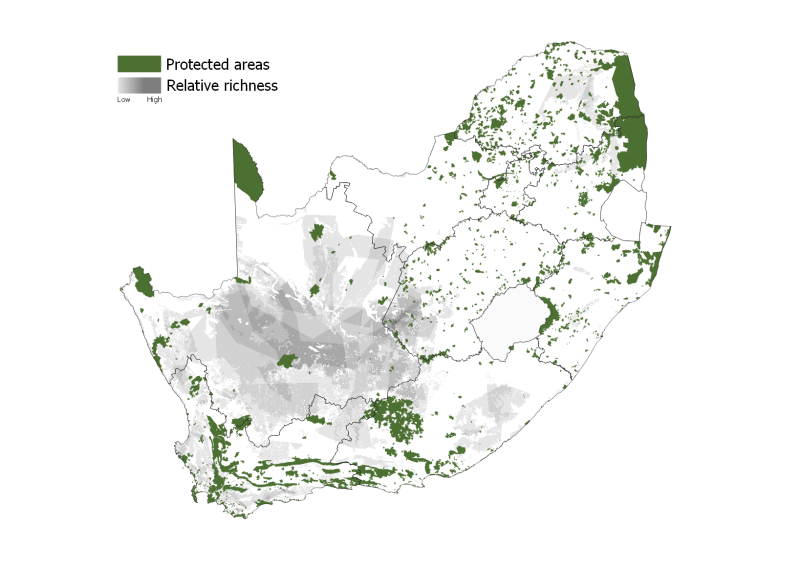
Protection level measures the contribution of South Africa’s protected area network to meeting plant conservation targets (Figure 6). The plant protection level assessment is applied to the same representative sample from the indigenous flora as used in the Red List Index. Most plants (70%) are Well Protected, however, plants have the second highest proportion of species that are Not Protected (14%), after freshwater fishes (see species protection level under integrated findings). Not Protected plants are found predominantly in the arid central region of South Africa where protected area coverage is sparse (Figure 7). These areas also align with the distribution of Not Protected and Poorly Protected terrestrial ecosystems.
Plant protection level has been assessed twice, in 2017 and 2024. Over this time, protection status improved for 7% of taxa but deteriorated for 1% of taxa (Figure 8). Protection status can change through expansion or contraction of the protected area network (as a result of protected area degazettement), or through changes in the effectiveness of protected areas in mitigating pressures on plants.
Improvements in protection level were the result of both protected area expansion and improvements in protected area effectiveness. The establishment of the Mountain Zebra-Camdeboo Protected Environment in a previously relatively poorly protected part of the Eastern Cape contributed most notably to improving the protection level for multiple plants.
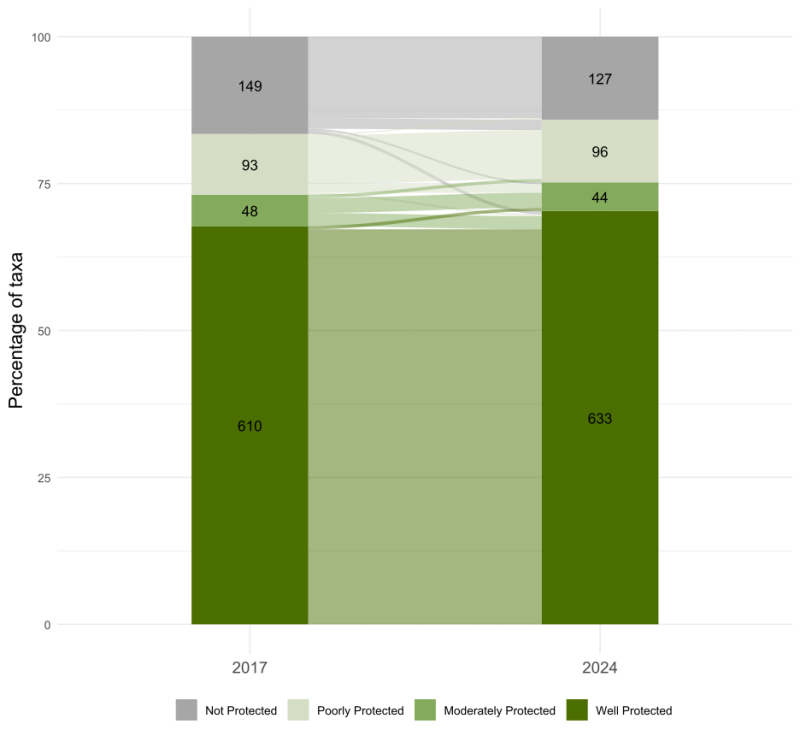
Protected area effectiveness can have a significant impact on plant protection level assessments. In 2017, 9% of taxa were downgraded at least one category due to insufficient protected area effectiveness. In 2024, this number improved to 7% of taxa. In the 2024 assessment, 2.5% of taxa were placed in higher protection level categories compared to 2017, solely due to improvements in the effectiveness of the protected areas where they occur. However, the 2024 assessment also highlighted how increasing pressures such as plant poaching, overgrazing, and drought are having significant impacts on protected areas’ capacity to protect plants from extinction. All taxa that were assessed in lower protection level categories in 2024 compared to 2017 were due to deteriorating protected area effectiveness, most notably in the Succulent Karoo region in the Northern Cape and Western Cape. Protected area degazettements, on the other hand, were minor and had no impact on protection level.
NoteBox 3. Calling all citizen scientists!
To contribute data to future Red List and protection level assessments of plants, you can join the Custodians of Rare and Endangered Wildflowers (CREW) Programme – a citizen-science initiative focused on the monitoring and conservation of South Africa’s threatened plants.
For more information, email crew@sanbi.org.za.
Alternatively, join these citizen science projects on iNaturalist
South African Red List: Plants and Animals and redlist (s Afr).
New to iNaturalist (or never heard of it) and want to play along? Watch these video tutorials to get started, and sign up on the iNaturalist website or download the app on your smartphone.
To see how valuable your nature photographs can be, watch this inspiring TED talk
Species recovery
South Africa, as a signatory to the Convention on Biological Diversity, is committed to taking urgent action to halt human-induced extinctions, reduce species’ risk of extinction, and improve their conservation status by 2030 (see Global Biodiversity Framework (GBF) Target 4). Achieving this target requires coordinated efforts to prevent and reverse species declines, recover and conserve populations, and maintain genetic diversity, particularly among threatened species. To contribute to the GBF Target 4 goals, South Africa has initiated a process with each taxonomic group that has comprehensive Red List assessments to identify and prioritise species in urgent need of recovery. Box 4 explains the prioritisation process for plant recovery.
NoteBox 4. A prioritisation process for plant recovery
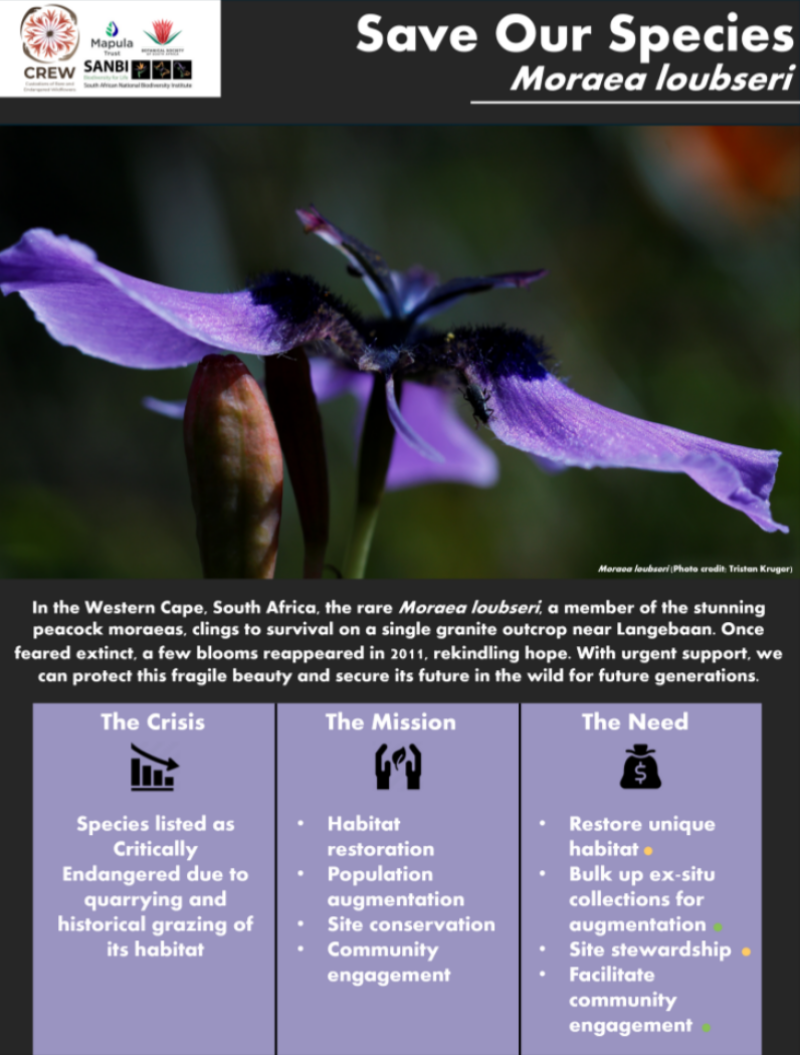
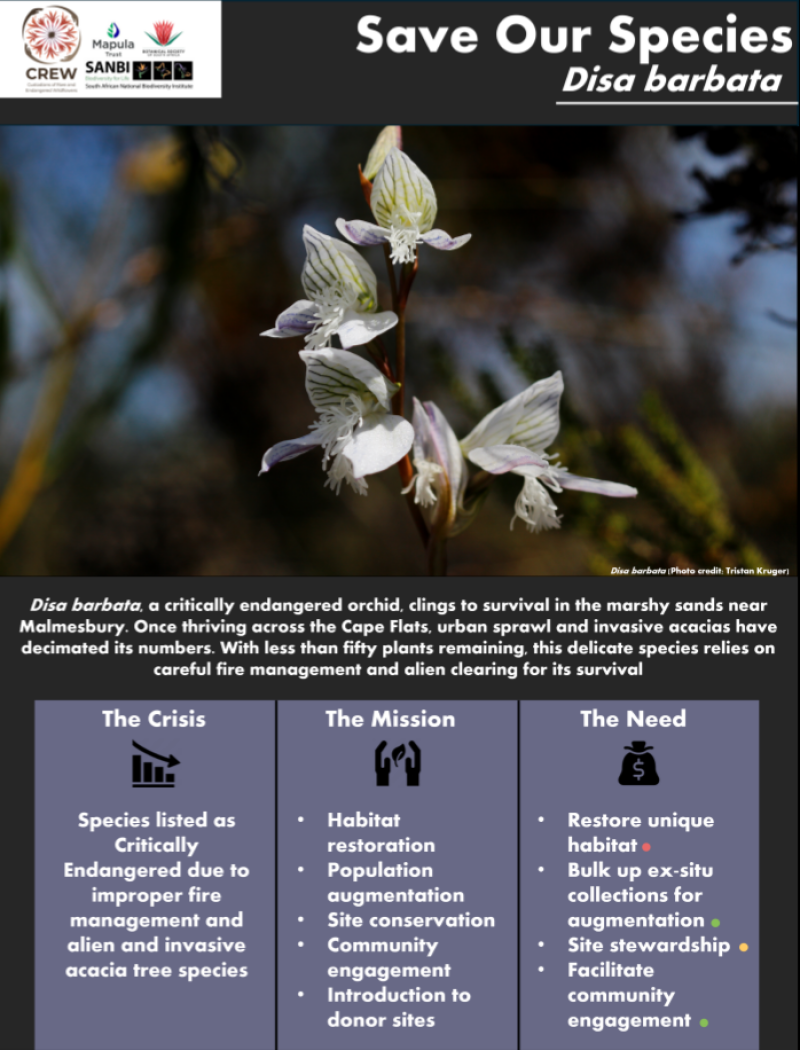
With over 3 000 plants threatened with extinction, multiple interventions to address threatened species declines are required, including the expansion of protected areas, the restoration of habitats that are being degraded by invasive species, and the inclusion of threatened plants in biodiversity sector plans. In addition, 293 Critically Endangered and Endangered plants need active recovery projects in order to ensure that they do not go extinct in the next decade.
Between 2020 and 2023, the South African National Biodiversity Institute (SANBI) led a process to prioritise plants in urgent need of recovery, using the IUCN Red List of Threatened Species Categories and Criteria to select those in most urgent need of recovery. A species recovery working group with members from conservation agencies and indigenous plant growers has been established, and each stakeholder has been allocated a handful of species on which to implement recovery work. A major upscaling of resources is required, as only 14 of the 293 species identified as needing urgent action have active recovery projects implemented.
Below are two examples of Critically Endangered plant species that require urgent recovery interventions to ensure their long-term survival. The factsheets outline the key activities needed, including habitat restoration, population reinforcement, and threat mitigation.
Click on images to enlarge
Approach
Threat status assessment
The IUCN Red List of Threatened Species Categories and Criteria are used to assess the threat status of plants in South Africa. The 2025 South African National Plant Checklist records 23 514 taxa and 21 539 species, of which 20 204 are indigenous. Remarkably, 60.5% of these indigenous species are endemic to the country. This enormous number of plants, and the very limited number of plant Red List specialists in the country, makes it challenging to reassess all plants regularly. Therefore SANBI coordinates and undertakes the assessments of selected families or genera each year. The Red List of South African Plants website hosts all national plant assessments. To track trends in extinction risk and identify the pressures driving these risks, a representative sample of 900 plant species is used for repeat assessments for each National Biodiversity Assessment.
Read more about how threat status is assessed here.
Protection level assessment
The species protection level assessment measures the contribution of South Africa’s protected area network to species persistence. It evaluates progress towards the protection of a population target for each species, set at the level of protection needed to support long-term population survival.
Read more about the calculation of the protection level indicator here.
Acknowledgements
Coordinated by:
Contributors
| Contributors | Affiliation |
|---|---|
| Anisha Dayaram | South African National Biodiversity Institute |
| Carol Poole | South African National Biodiversity Institute |
Technical documentation
Data sources
South African Biodiversity Institute (SANBI). 2024. Statistics: Red List of South African Plants. Available at: http://Redlist.sanbi.org. Accessed August 27, 2025.
South African National Biodiversity Institute (SANBI). 2019. National Biodiversity Assessment 2018: The status of South Africa’s ecosystems and biodiversity. Synthesis Report. South African National Biodiversity Institute, an entity of the Department of Environment, Forestry and Fisheries, Pretoria. pp. 1–214.
DFFE. 2024. South African Protected Areas Database (SAPAD), Version 2024_Q3 (modified by SANBI). DFFE, Pretoria. Available at: https://www.dffe.gov.za/egis. Accessed: 25 August 2024.
Code repositories
Protection level: Von Staden, L. 2025. SANBI-NBA Plant protection level indicator [Source code]. GitHub repository available at https://github.com/SANBI-NBA/plant-protection-level.
Technical reports
Protection level: Von Staden, L. 2025. Plant protection level indicator. National Biodiversity Assessment Technical Reports. South African National Biodiversity Institute, Pretoria. doi:10.6084/m9.figshare.30135625.
Recommended citation
Mtshali, H., Raimondo, D.C., Van Der Colff, D., Von Staden, L., Mhlongo, N.N., Hendricks, S.E., & Monyeki, M.S. 2026. Plants. National Biodiversity Assessment 2025. South African National Biodiversity Institute. http://nba.sanbi.org.za/.
References
1. Butchart, S.H.M. et al. 2004. Measuring global trends in the status of biodiversity: Red List indices for birds. PLoS Biology 2: https://doi.org/10.1371/journal.pbio.0020383
2. Skowno, A.L. et al. 2019. National biodiversity assessment 2018: The status of south africa’s ecosystems and biodiversity. South African National Biodiversity Institute.