
Areas of high cumulative pressure tend to translate into areas of poor ecological condition. The first groundtruthing of marine ecosystem condition shows that pressure mapping is an effective proxy at broad national scales, but that finer scale pressure mapping can improve condition estimates. Increased monitoring, further refinement of indicators and improved understanding of ecosystem responses to pressures are needed to support more accurate assessments of ecological condition (key message C2).
Ecological condition results
The condition map shows areas that are assessed to be in one of four categories of ecological condition: natural/near-natural, moderately modified, heavily modified and severely modified (Box 1). Critically modified areas were included in the heavily modified category in this assessment. In South Africa’s marine environment, critically modified components are only present in some shore ecosystem types, where infrastructure (coastal development or ports) has caused irreversible habitat loss.
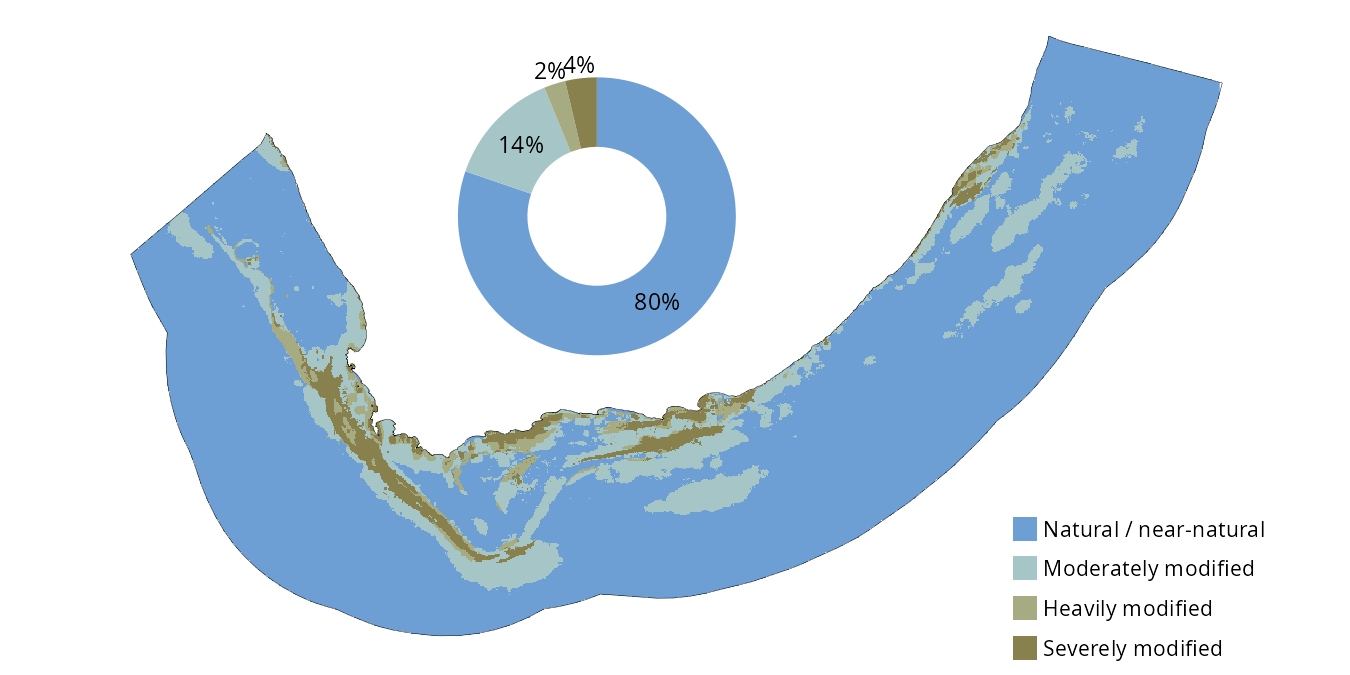
Areas of severely modified ecological condition in the benthopelagic and benthic ecosystems include the southwest Atlantic shelf edge, many inner shelf areas adjacent to the Western Cape, parts of the South Coast and shelf, and multiple areas in the KwaZulu-Natal Bight Figure 1. The ecological condition map for the marine realm was not updated for the 2025 NBA although some pressure layer updates are underway.
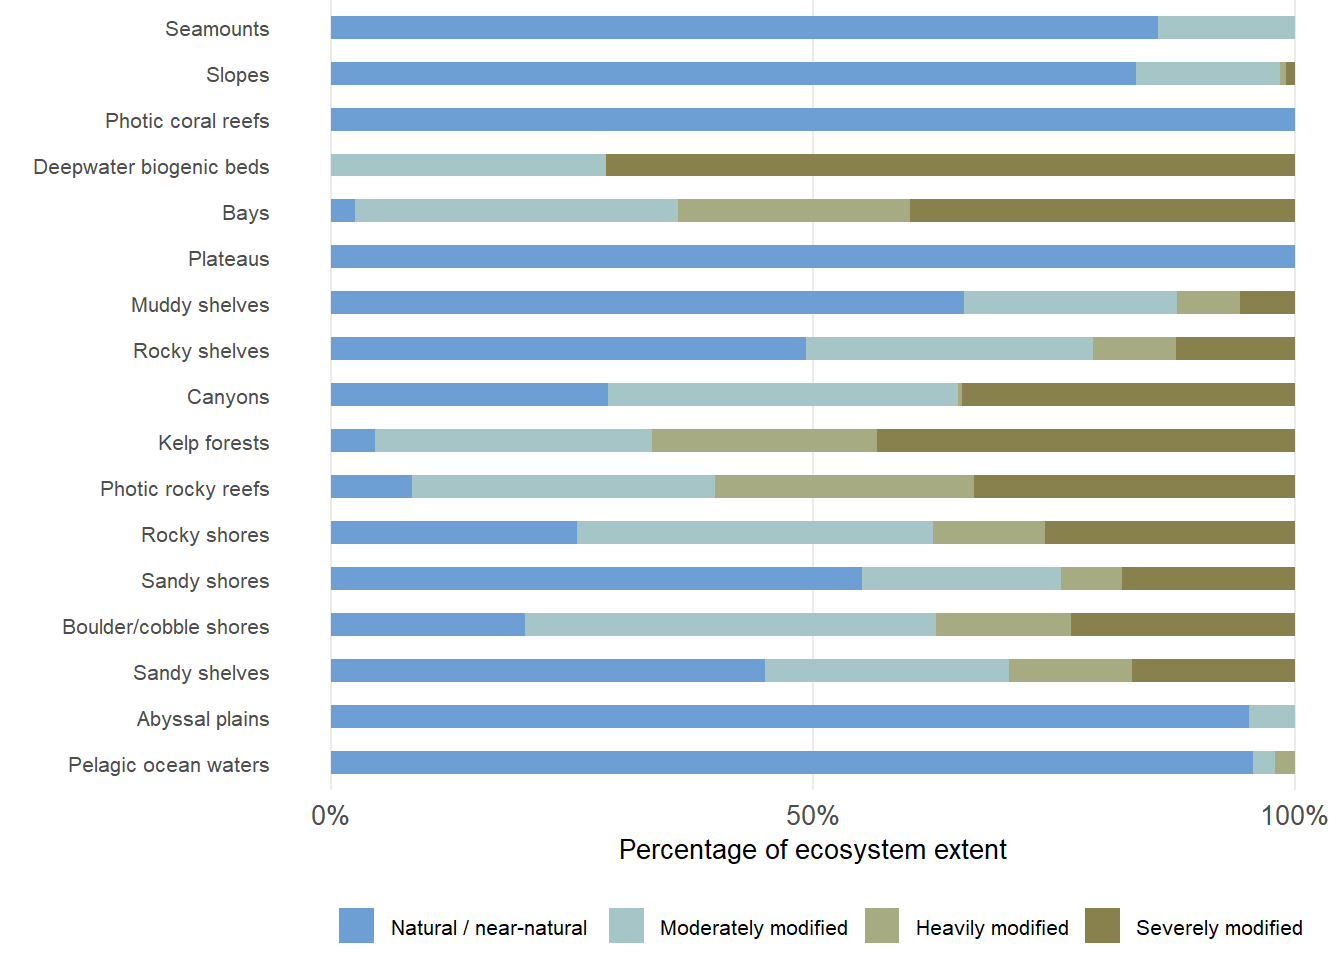
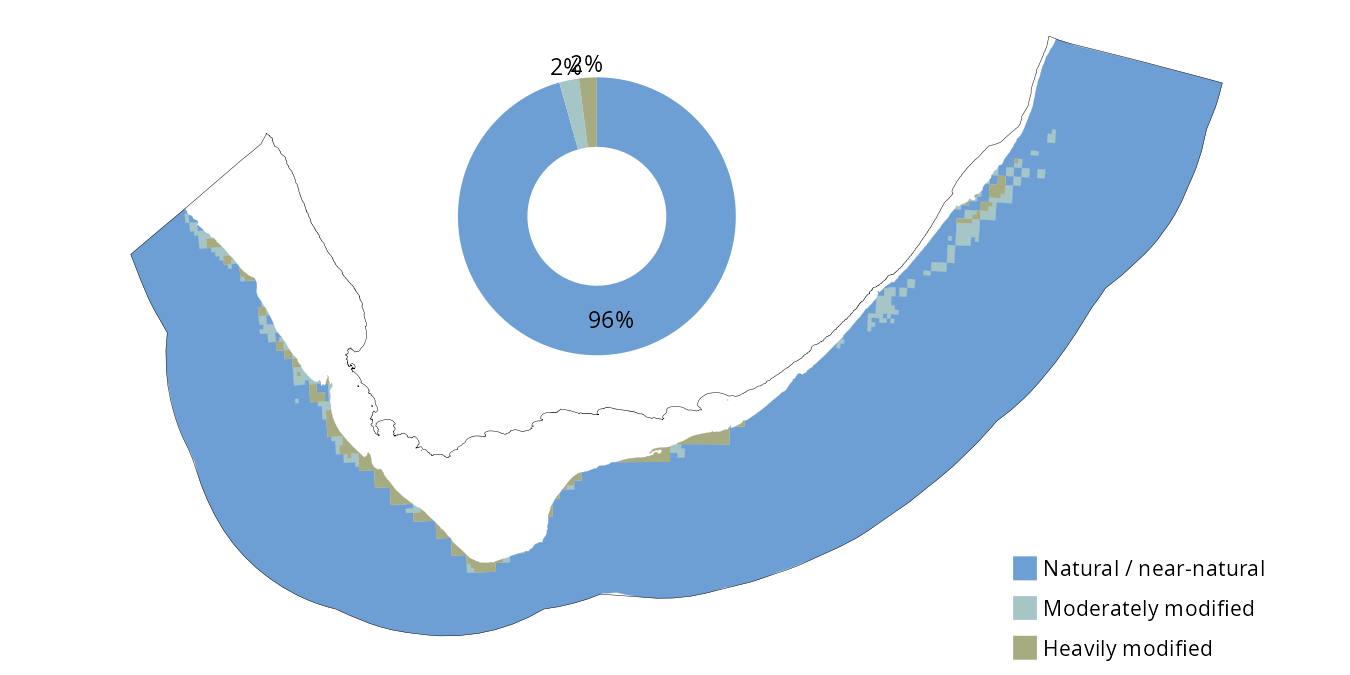
The marine realm has relatively high proportions of areas in the natural/near-natural ecological condition (Figure 1, Figure 2). However, ecosystem modification tends to be focused in pressure hotspots (such as bays, inner shelf and shelf edge areas), usually linked to local characteristics such as high productivity, accessibility and valuable natural resources, while large and often remote areas remain relatively lightly used and unmodified. Deepwater biogenic beds, bays and kelp forests have the highest proportion of ecosystem modification in terms of their extent (Figure 3).
Mining, coastal development and demersal trawling have the highest impact scores among the 31 pressures included in the assessment of ecological condition and contributed to heavily modified and severely modified ecological condition in some areas1. Fishing is the greatest driver of modified ecological condition in the offshore environment, whereas coastal development and fishing are the greatest drivers of ecosystem modification in inshore ecosystems. Flow reduction, waste water discharge and lethal shark control measures also drive high levels of ecosystem modification in some areas.
Groundtruthing ecological condition
Few cumulative impact studies validate their assessments of ecological condition, and groundtruthing ecological condition was a recommendation of the 2018 NBA. Smit et al. (2023)2 identified suitable indicators for condition assessments and defined reference conditions for rocky reef ecosystems, an important step in ecosystem assessment3. Subsequently, Smit et al. (2024)4 used rocky reef ecological data to compare reference conditions from well established MPAs against sites with varying cumulative pressures. This was later expanded to over ten MPAs spanning three ecoregions to assess functional diversity patterns at a broader scale5.
Results showed that ecological condition was significantly but weakly correlated with NBA cumulative impact scores, with notable discrepancies at finer scales, where some reefs were in better condition than predicted while others were worse4. The cumulative impact scores performed better as a proxy for the condition of fish communities than for benthic communities4. Although the cumulative impact map was an effective proxy at broad scales, the findings highlighted the need for finer-scale pressure mapping and ecological data to improve ecological condition maps and support more accurate spatial assessments.
Approach
Ecological condition in the marine realm was assessed by intersecting the spatial maps of pressures on biodiversity with the ecosystem map by following the approach shown in Figure 4. The assessment used the combined impact of 31 mapped pressures6 to assess ecological condition through the development of an ecosystem-pressure matrix1.
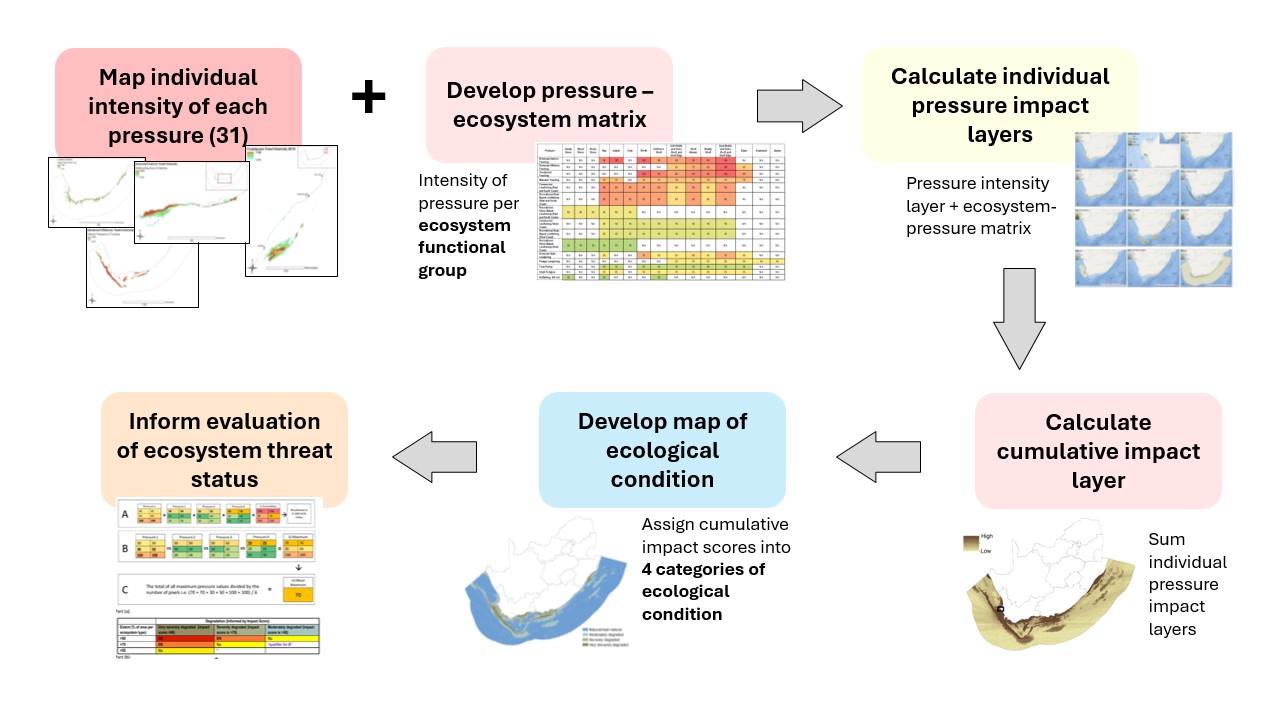
The ecosystem-pressure matrix represented impact scores per activity for each ecosystem functional group1. It was developed by experts scoring ‘functional impact’ and ‘recovery’ (Box 2), supported by a synthesis of information on pressures on marine biodiversity and using a guided group consensus method approach that was adapted from Teck et al. (2010)7.
Impact scores were calculated using a combination of the functional impact and recovery scores and scaled to values between 0 and 100. Draft values of impact score components were iteratively refined and updated with guidance of key specialists with local knowledge, until consensus values were obtained1.
Individual pressure impact layers were developed by combining the ecosystem-pressure matrix with the pressure intensity layer and ecosystem map to produce maps showing the impact of each activity across the seascape. In this way, each pixel of the pressure impact layer represents the extent to which the ecosystem type that exists there is impacted by the type and intensity of the pressure.
A map of cumulative impact was calculated by summing the individual pressure impact layer scores at each location (pixel)1. The resultant map represents the cumulative impact to the ecosystem type in each pixel, based on the type and intensity of all pressures recorded at that location.
To develop the map of ecological condition (e.g. Figure 1), the cumulative impact layer scores were divided into four condition categories that align with the four categories of degradation or disruption in criteria C and D of the IUCN Red List of Ecosystems methodology1.
It must be clarified that although the assessment was conducted using 30 x 30 m pixels, this does not imply that the ecosystem map or the results are accurate to this resolution. This high resolution was used to enable calculations at a sufficiently fine scale while accommodating the unique combinations of multiple pressures, pressure intensities, impacts and ecosystem types. The 30 x 30 m pixels reflect the units used for the numerical calculations, whereas the spatial accuracy is linked to the underlying accuracy of the ecosystem map and the pressure mapping. Improved finer-scale ecosystem and pressure mapping is a priority for future assessments.
Smit et al. (2023, 2024, 2026)2,4,5 made progress in field-based evaluations of site condition on rocky reefs. Such studies can be used to calibrate the cumulative impact scores and the classification thresholds used to assign condition categories. This work needs to be expanded to other ecosystem functional groups and further work is needed to investigate the use of different thresholds, ideally guided by field surveys that assess ecological condition indices.
Potential future improvements to the ecological condition mapping process include:
• Revise scoring of impact and recovery scores with new literature and greater international collaboration.
• Refine scoring guidelines and definitions for greater clarity and reproducibility.
• Develop different cumulative impact layers for different ecological condition assessment components (e.g. benthic, pelagic, ongoing decline versus pressures that have stopped, abiotic vs biotic degradation). These should be tailored to align with IUCN Red List of Ecosystems criteria.
• Apply learnings from research that can inform ecological condition thresholds.
• Increase knowledge on reference states of marine ecosystems for a diversity of indicators and a broader range of ecosystem functional groups.
• Continue to test and validate indicators for condition assessments under a variety of, and multiple, pressures.
• Explore application of the critically modified category in the marine realm (beyond shores) and its relationship to potentially novel or anthropogenic ecosystem types as defined by the IUCN Global Ecosystem Typology.
• Increase alignment of condition categories across realms.
Acknowledgements
The National Marine Ecosystem Committee and Network and the National Marine Biodiversity Scientific Working Group are thanked for their oversight of marine ecosystem assessments. The European Union’s Horizon 2020 research and innovation program under Grant Agreement No. 862428 (MISSION ATLANTIC) is thanked for funding advances in knowledge on ecosystem condition assessment. Authors and contributors of Smit et al. 20228, including participants who attended the SANBI/UCT/MISSION ATLANTIC ecosystem assessment workshop held Oct 2021 are thanked.
We also thank the authors of Sink et al. (2019)1 as well as participants of the 3-day Pressures scoring workshop held in 2017, including Andrew Cockcroft, Anthony Bernard, Anѐ Oosthuizen, George Branch, Jodie Reed, Lara Atkinson, Linda Harris, Loyiso Dunga, Luther Adams, Maphale Matlala, Megan van der Bank, Myriam Perschke, Olona Buswana, Siyasanga Miza, Sizo Sibanda, Stephen Kirkman and Steven Weerts. Participants of the 2018 NBA Review workshop are also acknowledged for useful insights into ecosystem condition assessment. Finally, we thank Andrew Skowno for his cross-realm leadership in ecosystem condition assessment.
Technical documentation
Key publications
Sink, K.J. et al. 2019. Chapter 7: Ecosystem Threat Status. In Sink, K.J. et al. (eds), South African National Biodiversity Assessment 2018 Technical Report Volume 4: Marine Realm: 249–282. South African National Biodiversity Institute, Pretoria.
Smit, K.P. et al. 2023. Identifying suitable indicators to measure ecological condition of rocky reef ecosystems in South Africa. Ecological Indicators 154: 110696. https://doi.org/10.1016/j.ecolind.2023.110696
Smit, K.P. et al. 2024. Groundtruthing cumulative impact assessments with biodiversity data: Testing indicators and methods for marine ecosystem condition assessments in South Africa. Aquatic Conservation 34: e4096. https://doi.org/10.1002/aqc.4096
Smit, K.P. et al. 2026. Depth and habitat drive spatial patterns in fish functional diversity: a trait-based assessment across South Africa and southern Mozambique. Marine Environmental Research 213: 107620. https://doi.org/10.1016/j.marenvres.2025.107620
Recommended citation
Sink, K.J., Majiedt, P.A., Currie, J.C., Besseling, N.A., Franken, M., Smit, K.P., & Holness, S. 2026. Ecological condition: Marine realm. National Biodiversity Assessment 2025. South African National Biodiversity Institute. http://nba.sanbi.org.za/.
References
1. Sink, K.J. et al. 2019. Chapter 7: Ecosystem threat status. In Sink, K.J. et al. (eds),: 249–282. South African National Biodiversity Institute, Pretoria.
2. Smit, K.P. et al. 2023. Identifying suitable indicators to measure ecological condition of rocky reef ecosystems in South Africa. Ecological Indicators 154: 110696. https://doi.org/10.1016/j.ecolind.2023.110696
3. Keith, D.A. et al. 2013. Scientific foundations for an IUCN red list of ecosystems. PLoS ONE 8: e62111. https://doi.org/10.1371/journal.pone.0062111
4. Smit, K.P. et al. 2024. Groundtruthing cumulative impact assessments with biodiversity data: Testing indicators and methods for marine ecosystem condition assessments in south africa. Aquatic Conservation: Marine and Freshwater Ecosystems 34: e4096. https://doi.org/10.1002/aqc.4096
5. Smit, K.P. et al. 2026. Depth and habitat drive spatial patterns in fish functional diversity: A trait-based assessment across South Africa and southern Mozambique. Marine Environmental Research 213: 107620. https://doi.org/10.1016/j.marenvres.2025.107620
6. Majiedt, P.A. et al. 2019. Pressures on marine biodiversity. In Sink, K. et al. (eds),: 152–246. Pretoria, South Africa.
7. Teck, S.J. et al. 2010. Using expert judgment to estimate marine ecosystem vulnerability in the california current. Ecological Applications 20: 1402–1416.
8. Smit, K.P. et al. 2022. A roadmap to advance marine and coastal monitoring, biodiversity assessment, and international reporting: A developing nation perspective. Frontiers in Marine Science 9: https://doi.org/10.3389/fmars.2022.886373