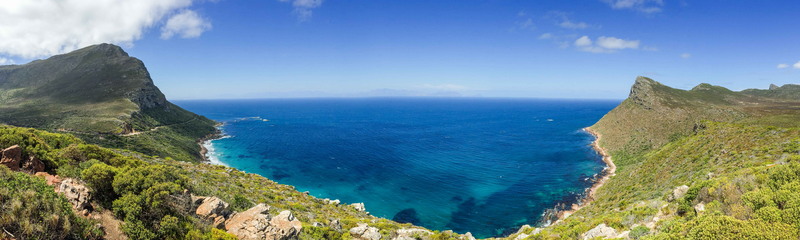
South Africa has exceptional marine biodiversity with 163 marine ecosystem types and high marine endemism linked to the intersection of three oceans and two contrasting current systems that interact with a diverse topographic and geological setting. Our marine biodiversity underpins food and job security, an expanding ocean economy, and is integral to the deep cultural and spiritual values held by many South Africans. The 2025 National Biodiversity Assessment identified marine ecosystems, species and benefits at risk, identified knowledge gaps that limit the assessment, and identified priority areas, together with co-developed priority actions, to safeguard ocean life, livelihoods and maintain the many benefits of South Africa’s rich marine biodiversity.
45%
of 163 ecosystem types
Threatened
of 163 ecosystem types
Threatened
20%
of 163 ecosystem types
Well Protected
of 163 ecosystem types
Well Protected
17%
of 163 ecosystem types
Not Protected
of 163 ecosystem types
Not Protected
36%
of 495 taxa assessed
Threatened
of 495 taxa assessed
Threatened
Ecosystem assessments
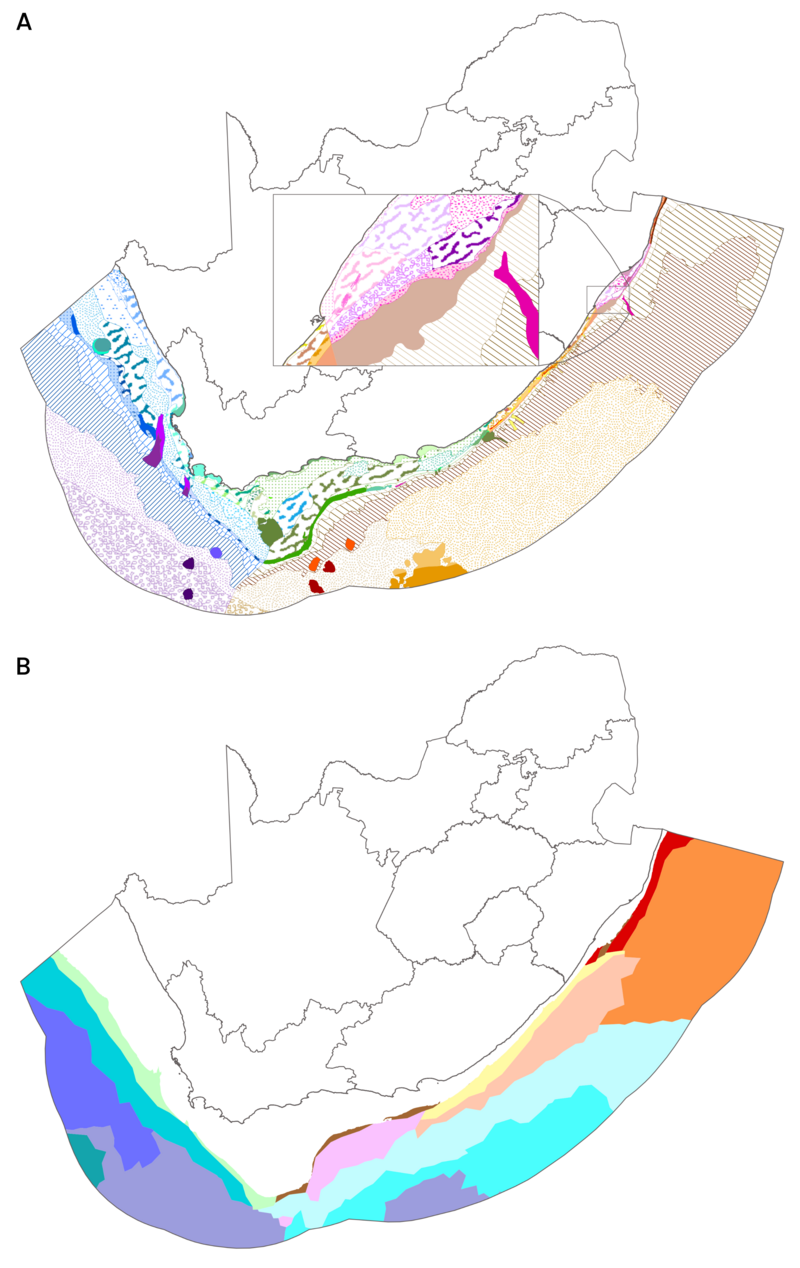
Of South Africa’s 163 marine ecosystem types, 45% are threatened, particularly smaller ecosystem types of restricted distribution. Several small, high-value ecosystem types are at risk of ecosystem collapse, which could compromise food and job security and climate resilience (key message A2).
Overall, coastal and shelf ecosystems are at higher risk of ecosystem collapse, and the most threatened ecosystem functional groups are bays, deepwater biogenic beds, muddy shelves and rocky ecosystems on the shelf. Unless collaborative efforts are made to improve ecological condition in these functional groups, the vital ecosystem services and benefits they provide are at risk (key message A2).
More than 80% of South Africa’s 163 marine ecosystem types now have some representation in the Marine Protected Area (MPA) network, but only 20% are Well Protected (key message B4). Slopes, abyssal plains, muddy and rocky shelves, and open oceans are the most Poorly Protected ecosystem functional groups.
Increasing the extent of South Africa’s MPA estate will contribute to improving ecosystem protection levels. For certain ecosystem types to advance to Well Protected status, however, their ecological condition inside MPAs needs improvement (key message C2). Ocean governance needs to better consider and involve human dimensions in conservation initiatives (key message C1), diversify protection models, and address persistent challenges that undermine the legitimacy of conservation areas.
In the marine realm, 17% of ecosystem types are both highly threatened and under protected. These ecosystem types are found on the West Coast, the western Agulhas Bank shelf edge, parts of the Agulhas Bank and parts of the KwaZulu-Natal Bight (see intersection of ecosystem threat status and protection level page).
Species assessments
Marine species are assessed in terms of their threat status and/or stock status. Stock status refers to the resource status from a fisheries management perspective, whereas species threat status focuses on extinction risk using the IUCN Red List of Threatened Species criteria.
Of the 495 marine species assessed using the IUCN Red List of Threatened Species criteria, 36% are considered threatened (key message B1). However, this is an inflated estimate of the actual proportion of marine taxa that are threatened because species that are at risk and/or economically important have been prioritised for assessment, with few marine taxonomic groups being comprehensively assessed.
There is increasing knowledge on stock status of resources, with evidence of resource recovery for some species linked to improved fisheries and spatial management (key message A5). This shows that fish stocks can recover with effective collaborative management of effort, catch and area. However, some inshore resources are increasingly depleted, and South African abalone (Haliotis midae) and West Coast rock lobster (Jasus lalandii) are Endangered. Illegal fishing plays a key role in the Endangered status of these species (key message A6).
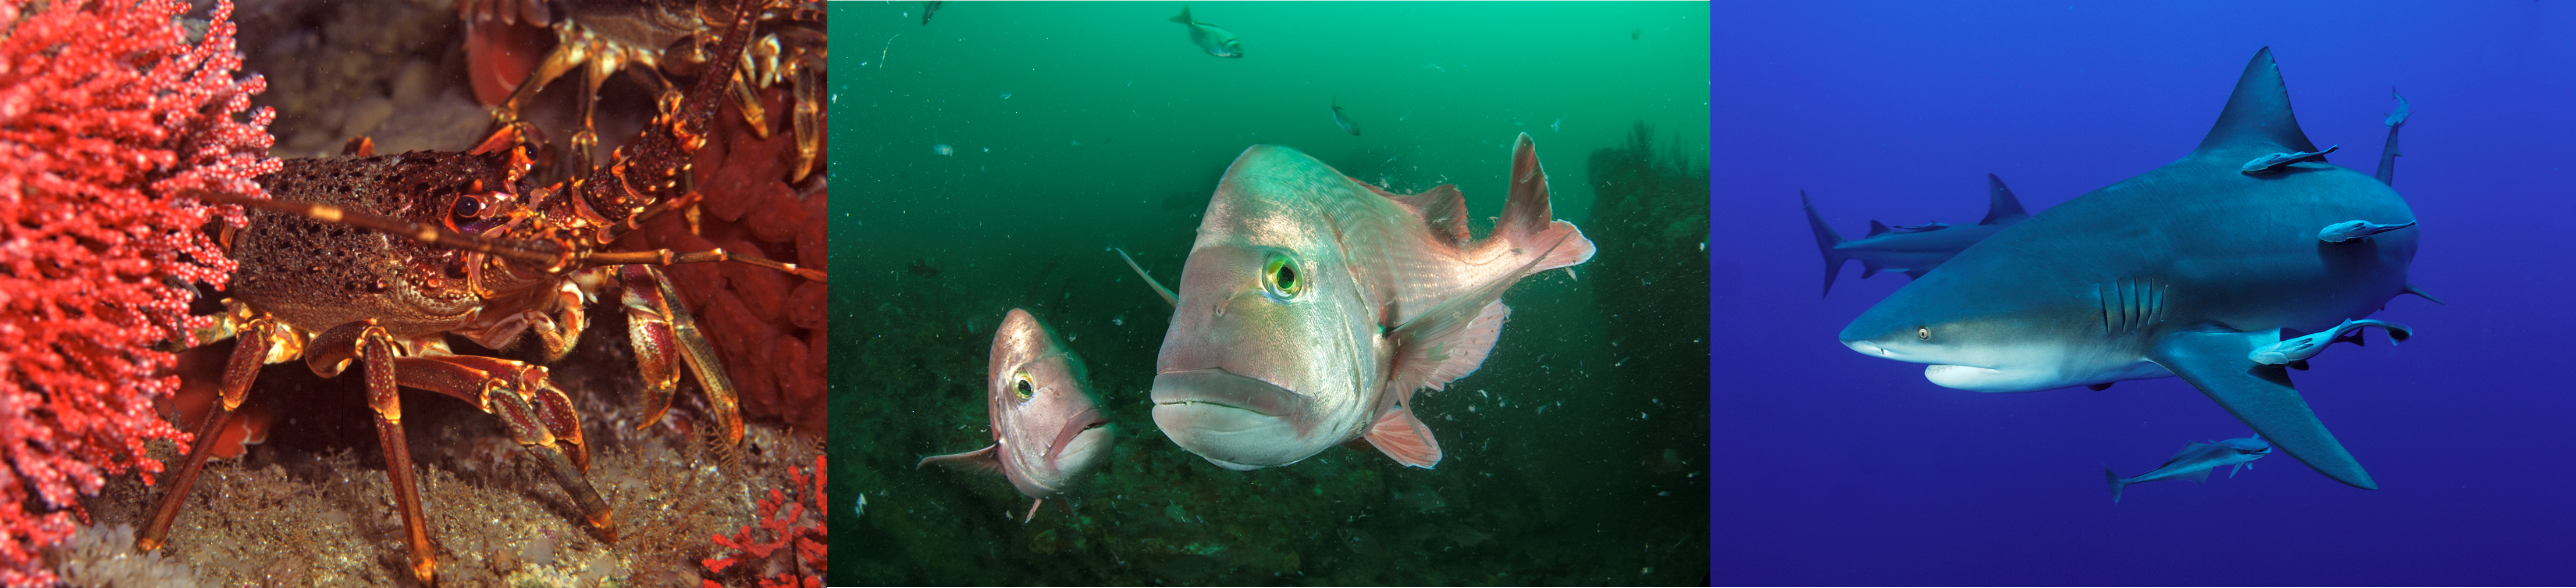
Sharks, rays and chimaeras are one of the most threatened groups across all realms (see species status page). A re-assessment of South Africa’s seabreams showed improved threat status for three species while two have become more threatened. Of the 97 South African shallow reef building corals assessed globally, 37% are threatened by climate change (key message A1).
Marine species continue to have the highest levels of data deficiency across all realms, signalling the need to address knowledge gaps, improve monitoring (key message C3), and increase capacity for marine species red listing (key message C3). High levels of data deficiency compromise effective species and ecosystem management, spatial planning, and decision-making.
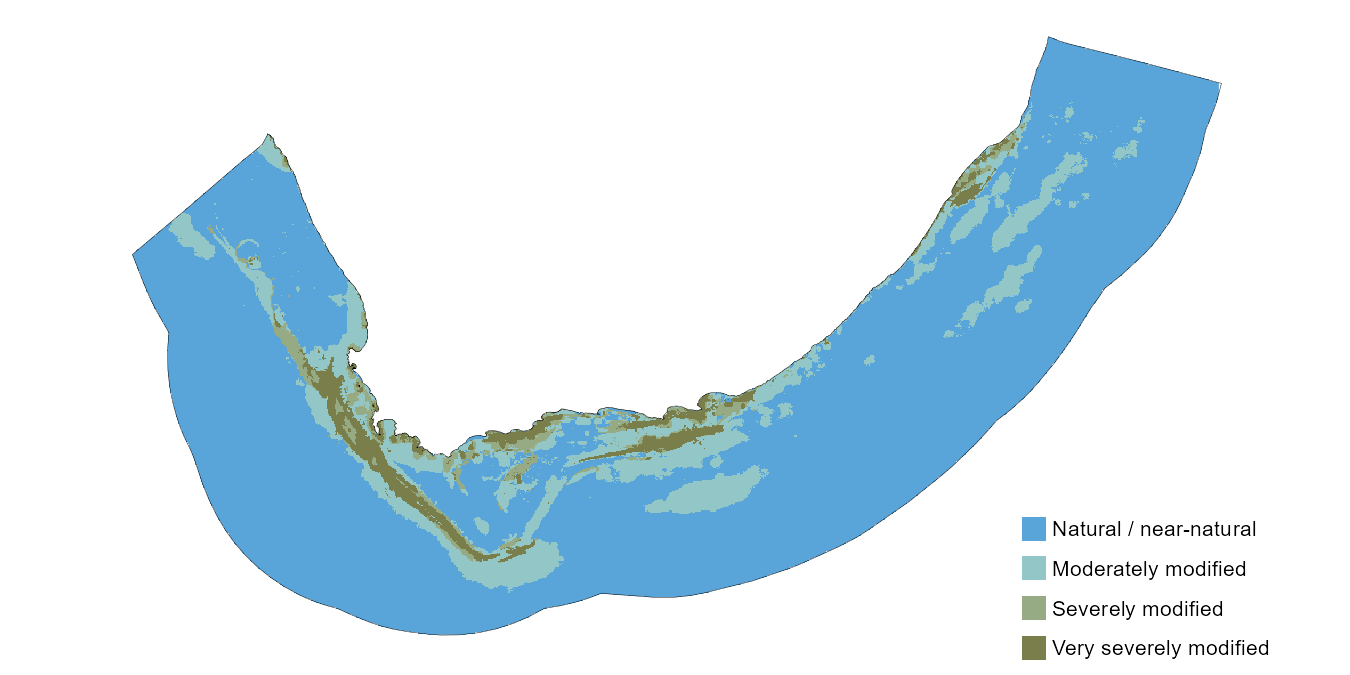
Pressures and ecological condition
There are many interacting pressures cumulatively affecting marine ecosystems and species. Key pressures impacting marine biodiversity are fishing (including industrial, recreational and illegal fisheries), coastal development (including ports and harbours), pollution, shipping, mining, freshwater flow reduction, lethal shark control measures and climate change.
Fishing, petroleum activities and shipping are widespread sectors resulting in many pressures on multiple ecosystem components and species. Fishing, particularly industrial fishing, continues to exert the greatest pressures on marine biodiversity (key message A5) impacting ecosystems, species and genetic diversity (key message B3).
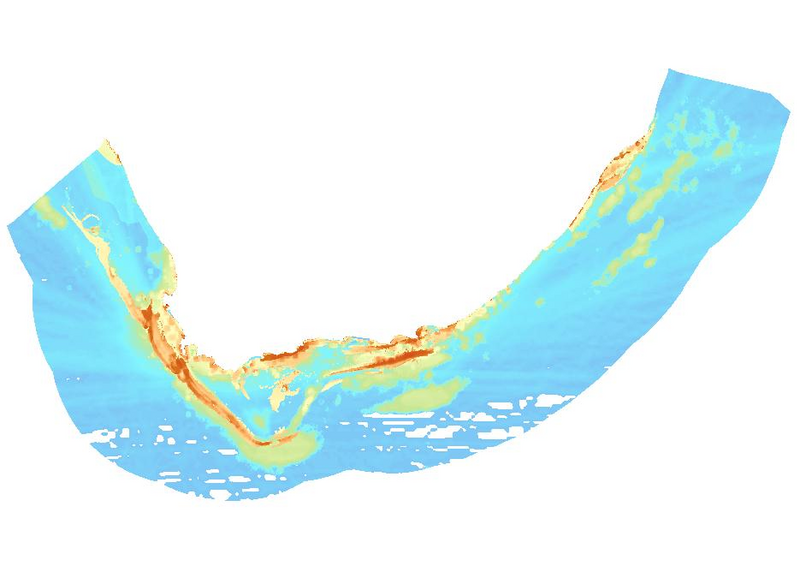
Hotspots of degradation and cumulative impacts are often driven by the location of ports and harbours, which increase access for fishing, alter shorelines and current circulation, increase pollution, and facilitate the introduction and spread of invasive species. Pollution including industrial, municipal and noise pollution are key escalating pressures. Seismic surveys to detect potential offshore oil and gas resources have been expanding into deeper waters and, together with shipping and other sources of underwater noise, pose uncertain risks to marine ecosystems and species. Renewable energy production is important in achieving energy security and reducing climate change impacts but marine renewable energy development requires careful consideration of marine biodiversity impacts.
The first groundtruthing of marine ecosystem condition shows that pressure mapping is an effective proxy at broad national scales, but that finer scale pressure mapping can improve condition estimates. However, despite their importance in spatial planning, most marine pressure data are outdated, leading to missing pressures, poor resolution of some pressures, and inaccuracy of pressure impacts on ecosystem condition. Increased monitoring is needed to support assessment of ecosystem and species (key message B5), and to quantify ecological condition more accurately for both biodiversity assessment and guiding management.
The impacts of cumulative pressures also warrant consideration at multiple scales, particularly in evaluating the impacts of expanding and diversifying ocean economy activities. Failure to account for indirect and cumulative impacts on biodiversity will mean that important impacts are missed, resulting in poor spatial planning and decisions, with negative impacts on people and the environment (key message A2).
Knowledge gaps, priority actions and priority areas
The NBA 2025 identified knowledge gaps limiting the assessment and research priorities that could strengthen biodiversity assessment, spatial and management planning, and enable decision-making underpinned by holistic science and diverse forms of knowledge.
Priority actions for improving the state of marine biodiversity were co-developed in collaboration with knowledge holders, policy and decision makers through a series of science-policy-society dialogues. More than 80 actions were advanced and these were distilled into 10 overarching actions with proposed indicators against which progress can be tracked (see Knowledge gaps, priority actions and priority areas page).
Spatial biodiversity priority areas to protect, restore and recover marine ecosystems and species have been identified and planning is being improved with increased participation, collaboration and technical innovation.
Drawing from key findings of the NBA, ten priority actions were co-developed for improving the state of marine biodiversity. Each of these are associated with several potential indicators for progress. The priority actions include:
Enable broader participation in ocean planning, assessment, management and governance. Read more »
Improve marine coordination within government and strengthen collaborations for improved ecosystem-based ocean management and decision-making. Read more »
Avoid, reduce and effectively manage industrial impacts to safeguard marine biodiversity and ecosystem services. Read more »
Ensure sufficient quantity and quality of freshwater flows to marine ecosystems. Read more »
Build on past successes to manage fisheries better and more fairly to improve ocean health and food and livelihood security. Read more »
Ensure that existing Marine Protected Areas (MPAs) function effectively, and expand and diversify South Africa’s conservation estate. Read more »
Update and advance spatial data and maps to strengthen marine biodiversity assessment, planning and management. Read more »
Ensure South Africa has the skills and infrastructure to manage and deliver expanding data for ocean planning and decision-making. Read more »
Maintain marine biodiversity benefits through improved statistics, communication and knowledge sharing. Read more »
Reduce climate risks to people and nature. Read more »
Acknowledgements
The NBA is produced by the South African National Biodiversity Institute (SANBI) as part of its mandate to report regularly to the Minister of Forestry, Fisheries and the Environment on the status of the country’s biodiversity. SANBI’s way of working is highly collaborative, recognising that such a technically demanding and wide-ranging scientific assessment cannot be achieved without substantial support from numerous partners and collaborators. The Marine Realm Assessment was conducted in collaboration with 211 individuals (25% Early Career Ocean Professionals), across 61 institutions, spanning academia, government and public organisations, industry associations, NGOs, community based organisations, and independent individuals. This Marine Realm Assessment would not have been possible without the substantial in-kind contributions of time, data and expertise from these individuals and institutions. Over the past six years, this multitude of dedicated collaborators invested 26 292 person hours (over 14 yrs of work) to strengthen the knowledge based that underpins the NBA 2025 Marine Realm Assessment.
We sincerely thank the National Marine Ecosystem Committee and Network for their invaluable technical expertise and guidance. The National Marine Biodiversity Scientific Working Group is thanked for its role as reference group for the Marine Realm Assessment of the NBA. The National Working Group 7 (Oceans and Coasts) is thanked for it valuable inputs and contributions to the draft marine key messages. We also acknowledge members of the Biodiversity Planning Technical Working Group, the National Ecosystem Classification Committees, and the NBA Core Reference Group for their input.
We acknowledge the National Research Foundation for funding research that provided key inputs into the NBA especially projects funded through the Foundational Biodiversity Information Program (FBIP) and the African Coelacanth Ecosystem Program (ACEP). These include the SAEON led SeaMap project (Grant number 138572) and ACEP Deep Forests (Grant number 110765), Deep Connections (Grant number 129216), Agulhas Bank Connections (Grant number 129213) and Sound Seas projects (Ref number ACEP23040790163). International funding support was provided through the European Union’s Horizon 2020 Research and Innovation Program under Grant Agreement No. 862428 (MISSION ATLANTIC project) and 818123 (iAtlantic project), the German Federal Ministry for Economic Cooperation and Development (BMZ) through the Deutsche Gesellschaft für Internationale Zusammenarbeit (GIZ) GmbH for the MeerWissen CoastWise project, and the UK Research and Innovation (UKRI) through the Global Challenges Research Fund (GCRF), Grant ref: NE/S008950/1, for the One Ocean Hub project.
![]()