The trend in species status over time was measured using the globally recognised indicator, the IUCN Red List Index of species (RLI). The RLI is calculated for specific taxonomic groups based on genuine changes in Red List categories over time. The RLI value ranges from 0 to 1 where lower values indicate that more species within the taxonomic group are at a high risk of extinction, the slope of the plot shows the rate of decline towards extinction. If the value is 1, all taxa are Least Concern and if the value is 0, all taxa are Extinct. The RLI is calculated only for comprehensively assessed taxonomic groups or groups where a representative sample has been selected. Changes in status over time have been tracked for 13 taxonomic groups (Figure 1).
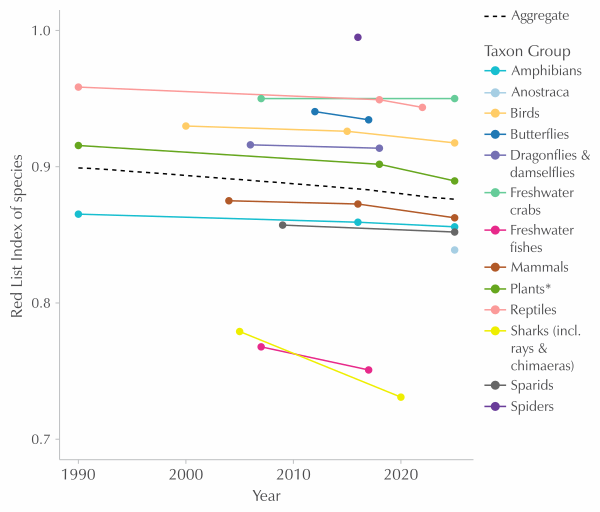
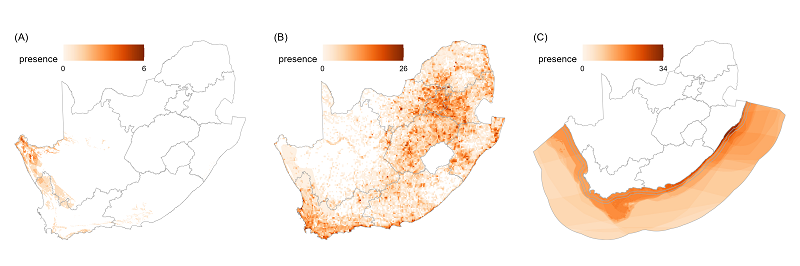
Increases in extinction risk are evident for most groups, but a marked increase in rate of extinction since the last assessment is evident from the change in slope of declines for reptiles, birds, mammals and plants (Figure 1). Increases in threat status for birds have largely been due to freshwater birds impacted by increasing levels of pollution and other forms of habitat degradation, while the main drivers of declines for mammals, plants and reptiles have been climate change and loss of habitat for mining and renewable energy developments. Most plants that have been uplisted due to increasing levels of extinction risk are found in the Northern Cape (Figure 2). The province was severely impacted by the drought over the past decade, and is experiencing ongoing pressure from mining, succulent poaching and renewable energy developments. The two groups at highest risk of extinction are freshwater fishes and cartilaginous fishes. Sharks, rays and chimaeras are included on South Africa’s RLI for the first time, with the majority having wide ranges that extend outside South African territory. Many of these cartilaginous fishes are long-lived, have slow growth and low reproductive output, and many are declining across their ranges due to overfishing (including from recreational fisheries and as bycatch from industrial fisheries), lethal bather protection measures and habitat degradation. Half of South Africa’s freshwater fishes are endemic, with many concentrated in Western Cape river systems. While only due for reassessment in 2026, the declining status of rivers and dwindling resources available for management actions where many of these species are concentrated likely means that they will continue on a declining trajectory.