
The protected area network is growing across South Africa, thanks to innovative biodiversity stewardship programs, leading to a general increase terrestrial ecosystem protection levels.
26%
of 463 terrestrial ecosystem types
Well Protected
of 463 terrestrial ecosystem types
Well Protected
10%
of landmass
Protected
of landmass
Protected
Ecosystem protection level results
Ecosystem protection level measures the degree to which ecosystem types are represented in the protected area network. Ecosystem types are assigned to one of four categories based on a set of predefined ecosystem targets (ranging from 16 to 32%)1,2. Well Protected (WP) ecosystem types are those where the extent target is met or exceeded within the protected area network, Moderately Protected (MP) types are those with between 50 and 99% of their target within the protected area network, Poorly Protected (PP) types have between 5 and 49% of their target within the network, and types with less than 5% of their target within the protected area network are categorised as Not Protected (NP). Read more about this indicator on the about ecosystem protection level page.
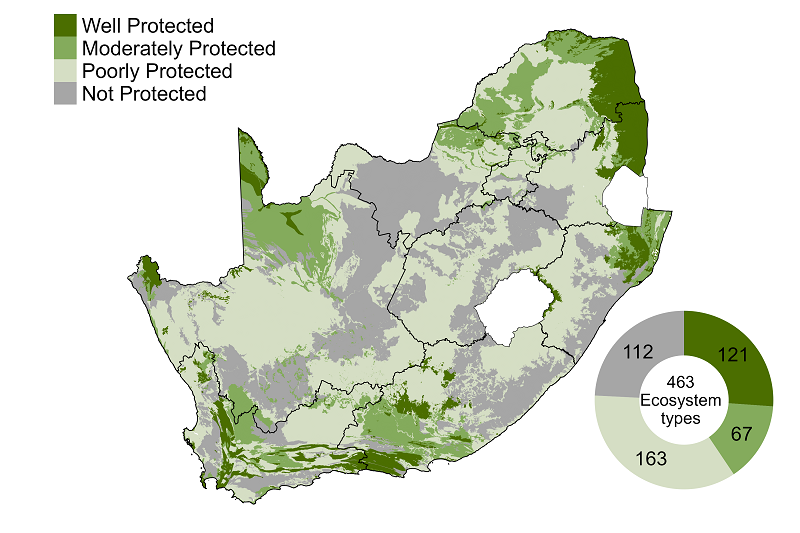
Over three-quarters (76%) of South Africa’s 463 terrestrial ecosystems received some form of statutory protection. However, levels of protection vary widely; 121 ecosystems are Well Protected, 67 are Moderately Protected, 163 are Poorly Protected and 112 are Not Protected.
| Categories (Protection Level) | Number of ecosystems | Percentage of all ecosystems that fall into each Protection Level | Natural extent remaining by Protection Level in South Africa, 2022 (km²) | Percentage of the remaining natural extent (by Protection Level) |
|---|---|---|---|---|
| Well Protected | 121 | 26.1% | 111590.7 | 11.4% |
| Moderately Protected | 67 | 14.5% | 167521.3 | 17.1% |
| Poorly Protected | 163 | 35.2% | 468453.2 | 47.8% |
| Not Protected | 112 | 24.2% | 233379.8 | 23.8% |
| Total | 463 | 100% | 980945.0 | 100% |
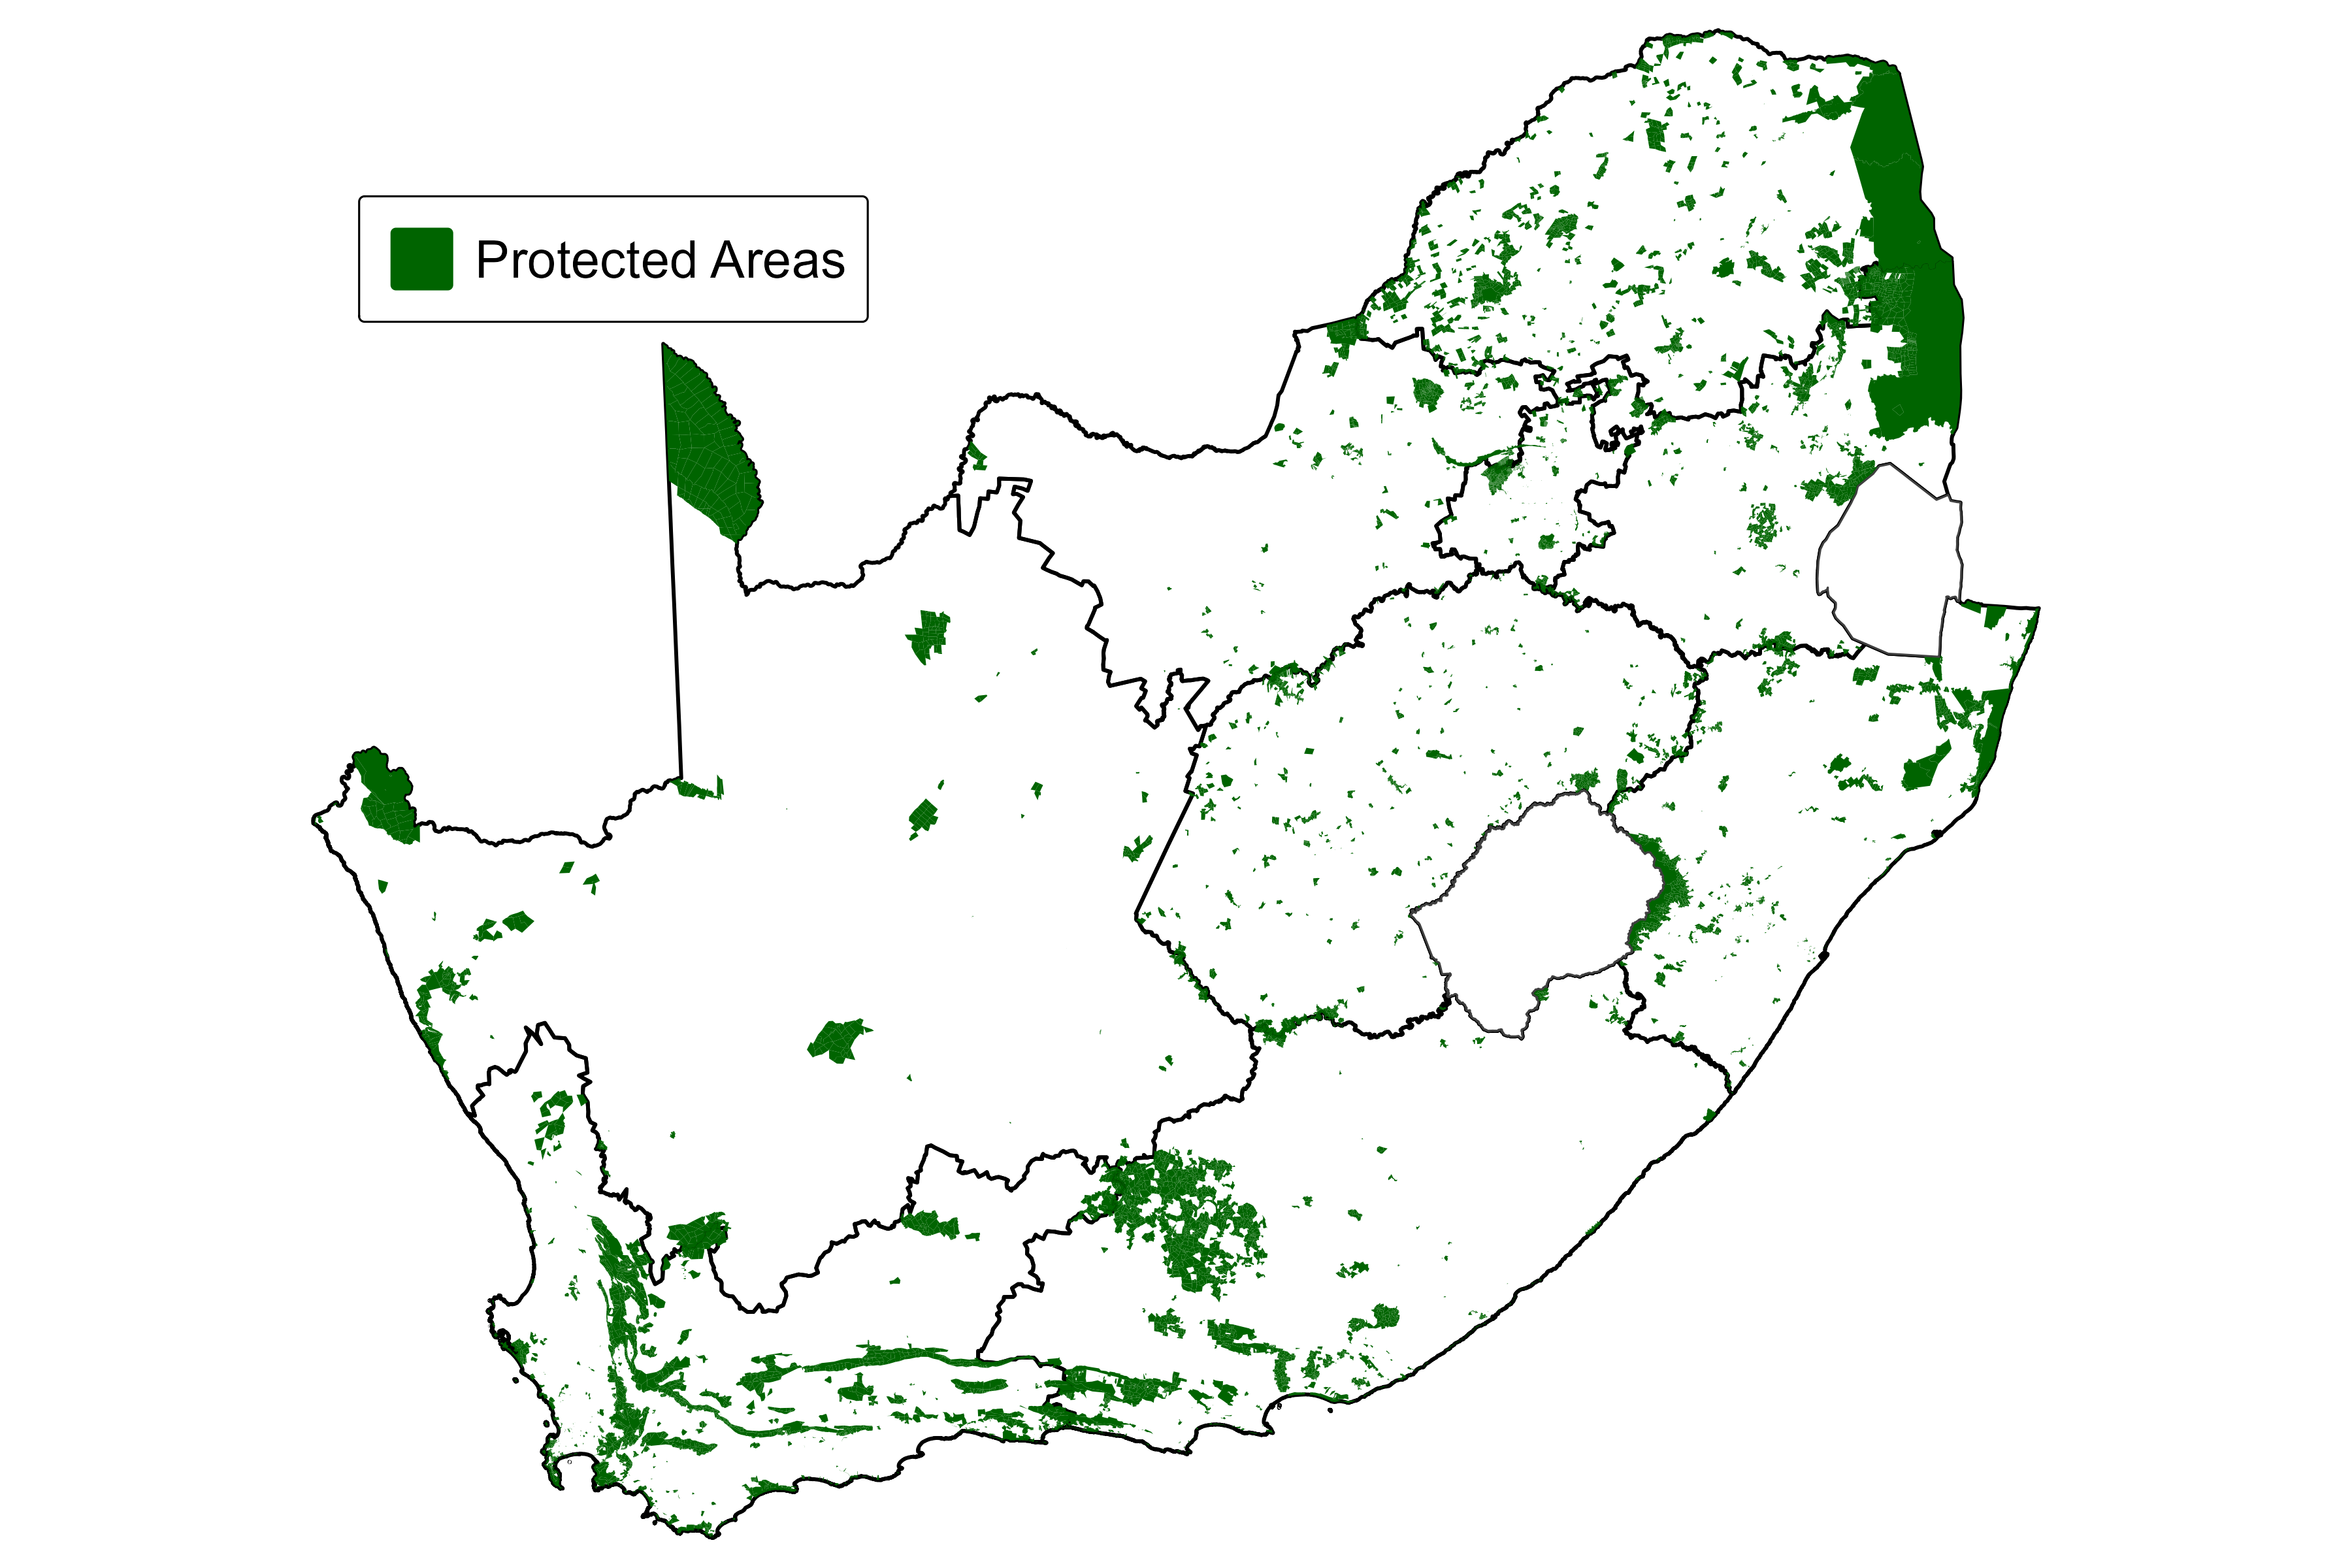
The proportion of South Africa’s total terrestrial extent under formal protection (in categories recognised under the Protected Areas Act3) has increased steadily over the last 15 years, from approximately 7.8% in 2000 to 9.9% at the start of 2025 (Figure 1). This expansion reflects the declaration of new protected areas primarily through biodiversity stewardship programs. Other effective area based conservation measures (OECMs) have not yet been fully assessed and mapped in South Africa and it is likely that the Protected and Conserved Areas estate (including both PAs and OECMs) covers substantially more than 10% of the landmass.
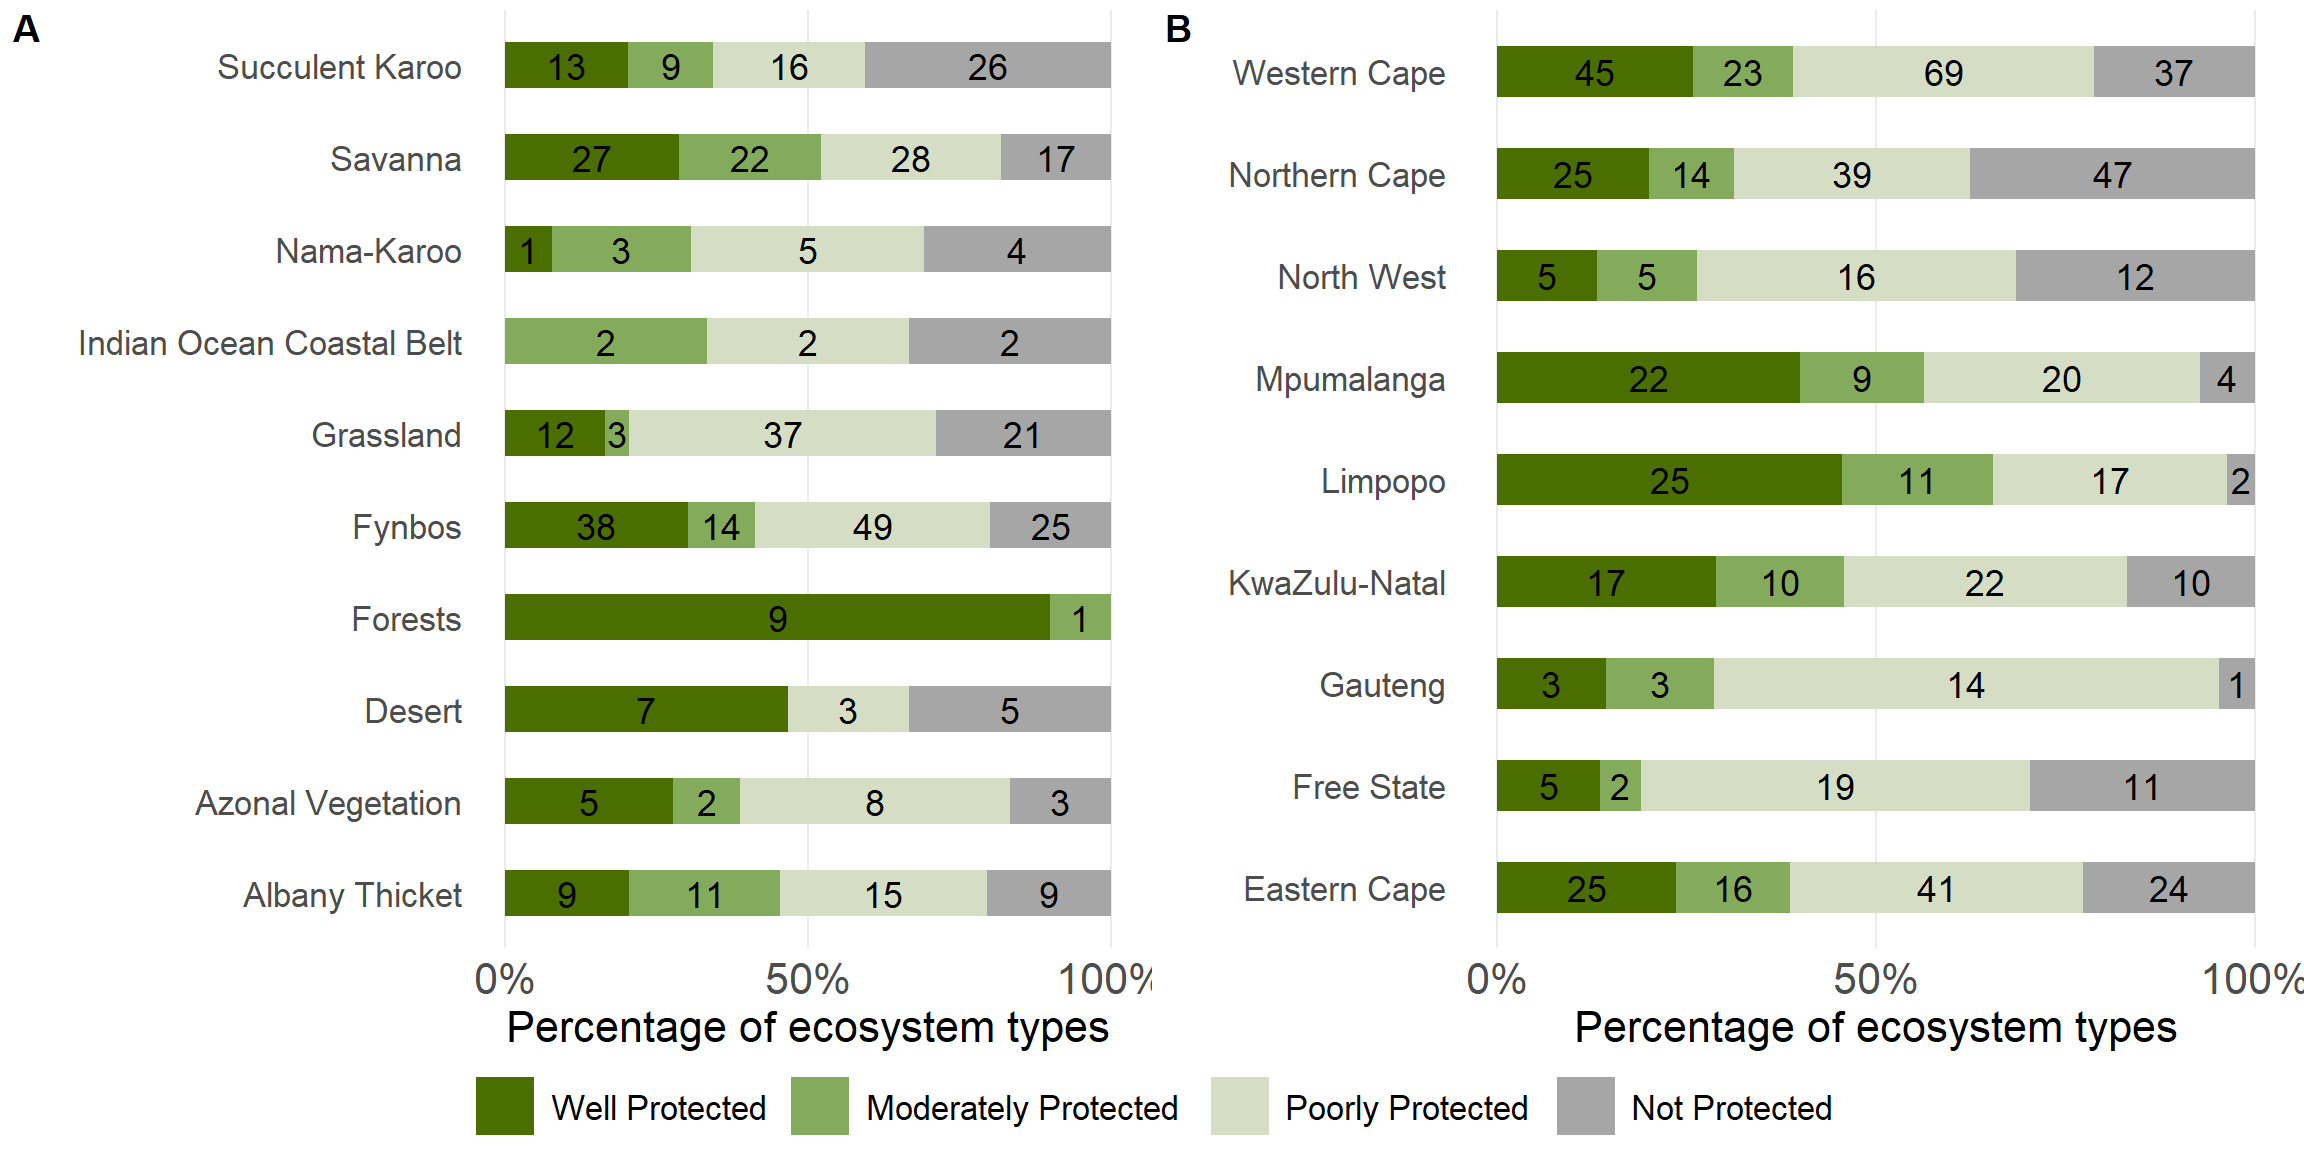
Biome and provincial level results
At a biome level, most Well Protected ecosystems are concentrated in the Fynbos (38) and Savanna (27). The very large National Parks (Khalahari Gemsbok and Kruger) in the Savanna Biome and the extensive Provincial Protected Areas and Mountain Catchment Areas in the Fynbos Biome mean that protection targets for numerous ecosystem types are met or exceeded. The Forest Biome, which has a limited natural extent in South Africa, is Well Protected, in part due to regulations related to the National Forests Act4 and cultural practices. In contrast lowland Fynbos, grassland and Karoo ecosystems tend to be under protected (Poorly Protected or Not Protected) (Figure 3) reflecting the need to improve their representation in the protected area network (Figure 2).
Ecosystem protection patterns at the provincial scale largely mirror those observed at the biome level. The Western Cape, Northern Cape, and Eastern Cape contain the highest numbers of under-represented ecosystems within the protected area network (Figure 3), many of which overlap with the Cape Floristic Region, a globally recognised biodiversity hotspot with exceptionally high ecosystem diversity. In contrast, provinces such as Gauteng and Limpopo, which have fewer ecosystems overall, still exhibit a high proportion of under-protected ecosystems (Figure 2), highlighting persistent gaps in representation even where total ecosystem numbers are lower.
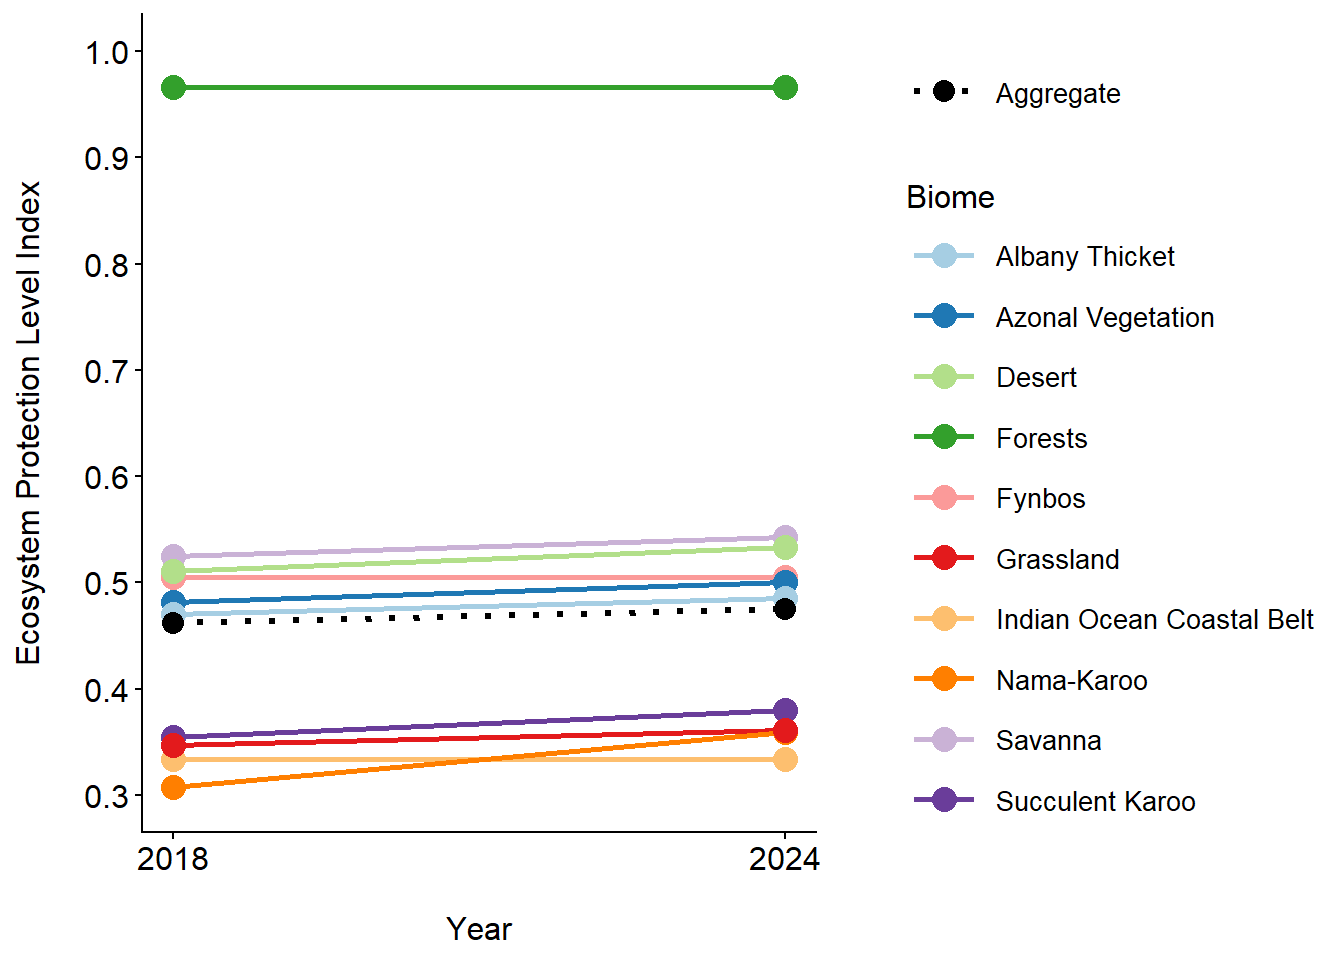
Ecosystem Protection Level Index
Ecosystem Protection Level can be tracked over time using the ecosystem protection level index (EPLI). The overall (aggregate) trend between 2018 and 2024 reflects the steady increase in the PA estate overall, mostly due to various biodiversity stewardship programs and the establishment of a new National Park in the Nama-Karoo (note the low level of protection for the Nama-Karoo and the more pronounced increase in protection level since 2018). The EPLI plot shows how well protected the Forest Biome is, but it also shows that that no increase in protection have occurred in the biome recently.
Approach
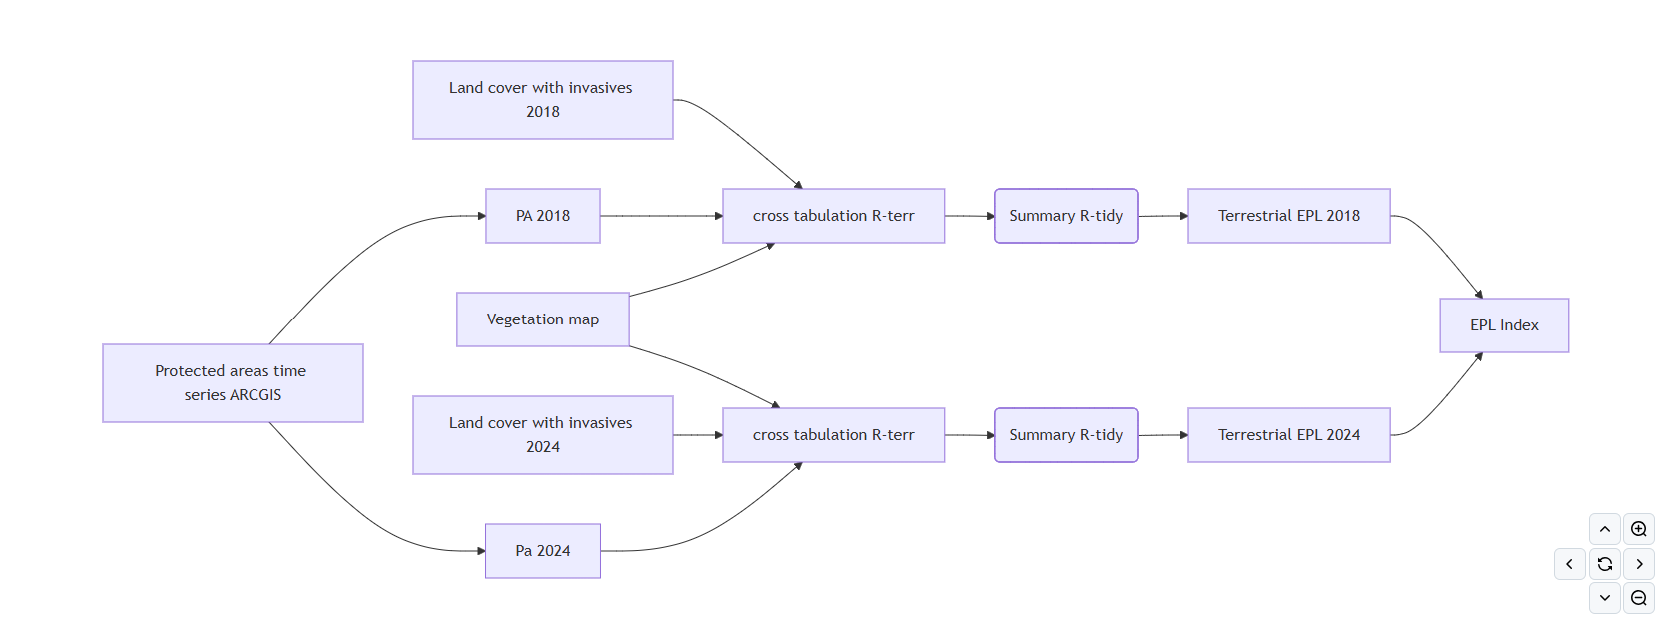
Terrestrial ecosystem protection level was calculated by assessing the degree to which protected areas targets for each ecosystem were met. Land cover, invasive alien plant data, terrestrial ecosystem maps (vegetation map) and protected areas maps for 2018 and 2024 were cross tabulated, allowing the calculation for each ecosystem type: i) the full extent of the type, ii) the full extent of the type within the PA network, iii) natural remaining the extent of the type within the PA network (including invaded areas), iv) the extent of invasion by alien plants within the PA network for each type.
The extent of each type within the PA network was adjusted for habitat loss and invasion. The natural remaining extent within the PA network was adjusted downwards by subtracting 70% of the invaded extent within the PA network. This step ensures that effectiveness of PA network is accounted for to a degree by preventing areas heavily degraded by invasive alien plants from fully contributing to ecosystem representation targets.
Ecosystem protection level index (EPLI) calculation (Harris et al., in review) is based on the concept of the Red List Index of Species and tracks changes in protection categories between time points (Figure 5).
Technical documentation
Code repository
Skowno, A.L. 2025. SANBI-NBA Terrestrial ecosystem protection level [Source code]. GitHub repository available at https://github.com/askowno/EPL_terr.
Key publications
Linda R. Harris, Andrew L. Skowno, Stephen D. Holness, Kerry J. Sink,Lara van Niekerk, Heidi van Deventer, Lindie Smith-Adao, Nancy Job, Sediqa Khatieb, Maphale Monyeki (in review). Indicators for tracking progress in effective, representative ecosystem protection.
Recommended citation
Skowno, A.L., Monyeki, M.S., & Khatieb, S. 2026. Ecosystem protection level: Terrestrial realm. National Biodiversity Assessment 2025. South African National Biodiversity Institute. http://nba.sanbi.org.za/.
References
1. Reyers, B. et al. 2007. Developing products for conservation decision-making: Lessons from a spatial biodiversity assessment for south africa. Diversity and Distributions 13: 608–619. https://doi.org/10.1111/j.1472-4642.2007.00379.x
2. Desmet, P. & R. Cowling. 2004. Using the speciesarea relationship to set baseline targets for conservation. Ecology and Society 9: https://doi.org/10.5751/ES-01206-090211
3. Government of South Africa. 2003. National environmental management: Protected areas act.
4. Government of South Africa. 1998. National forests act of south africa.