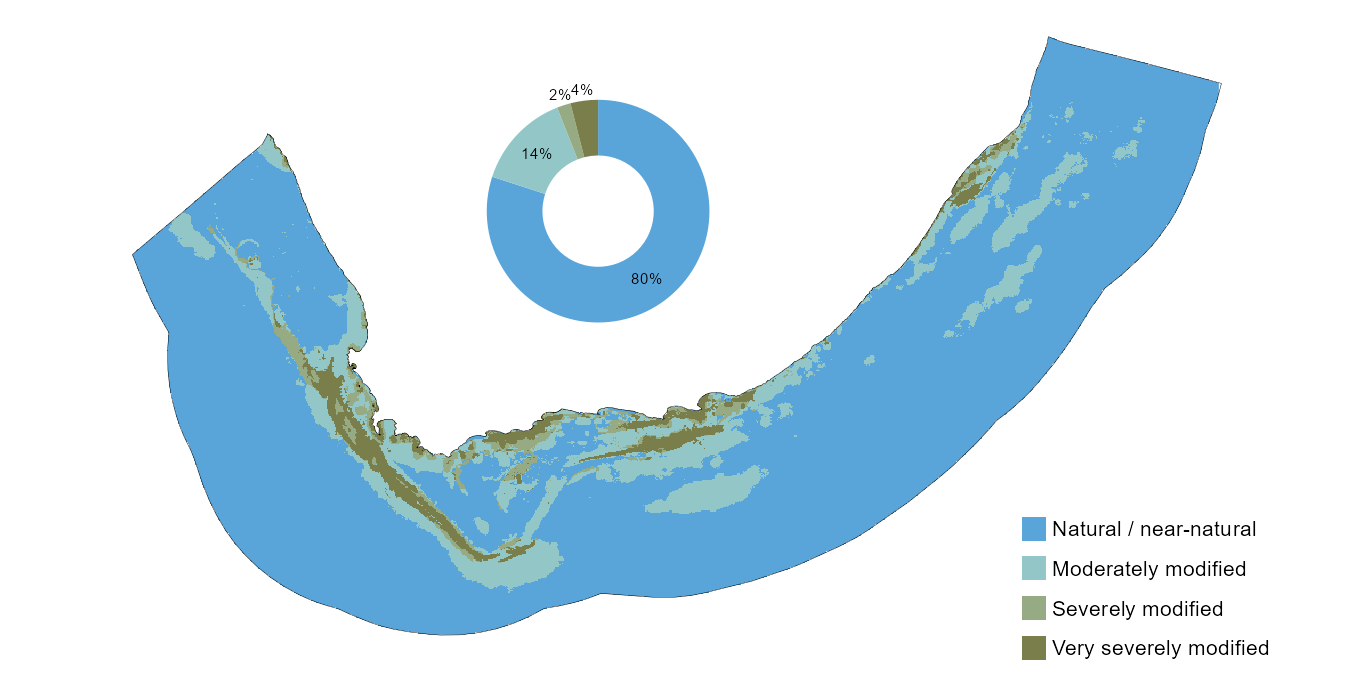
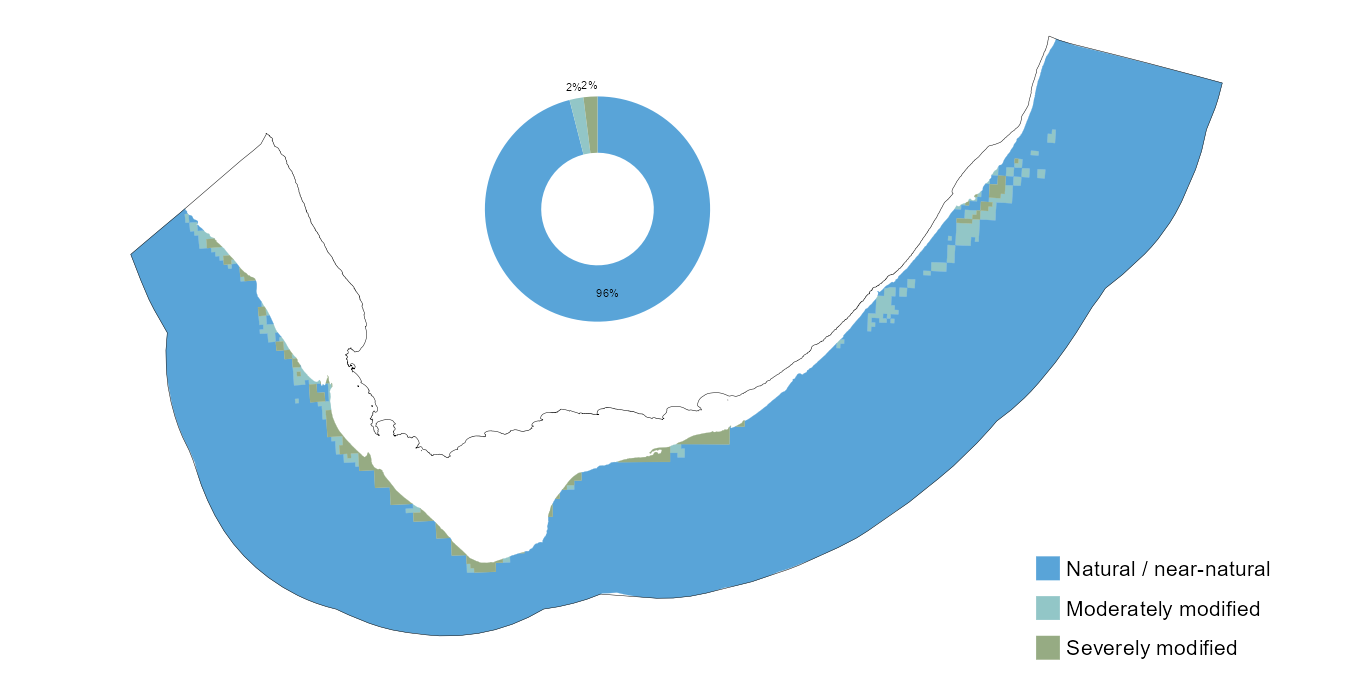
Areas of high cumulative pressures and poor ecological condition have been identified, particularly along the southwest Atlantic shelf edge and in the inner shelf of much of the western Cape, parts of the south coast and shelf and several areas in the KwaZulu-Natal Bight (Figure 1). The ecological condition map for the marine realm was not updated for the 2025 NBA although some pressure updates have been underway. The first ground-truthing of marine ecosystem condition shows that pressure mapping is an effective proxy at broad national scales, but that finer scale pressure mapping can improve condition estimates. Increased monitoring is needed to support more accurate assessments of ecological condition (Link to KMC2).
The marine realm has a relatively high percentage of natural/near-natural ecosystem extent (~x%; Figure 1, Figure 2), similar to the terrestrial realm. In these extensive realms, ecosystem modification tends to be focussed in pressure hotspots, usually linked to local characteristics such as high productivity, accessibility and valuable natural resources; while large areas remain relatively unmodified or intact.
Port photo?
Mining photo?
Mining, coastal development, trawling and mariculture have the highest impact scores among the 31 pressures included in the and led to poor ecological condition in some areas. Fishing is the greatest cause of degradation in the offshore environment, whereas coastal development and fishing are the greatest drivers of poor condition in inshore ecosystems. Flow reduction, waster water discharge and lethal shark control measures also drive poor condition in some areas.
Hotspots of degradation and cumulative impacts are often driven by the location of ports and harbours, which increase access for fishing, alter shorelines and circulation, increase pollution, and facilitate the introduction and spread of invasive species. Port and harbour location therefore warrants careful consideration. Areas of poor ecological condition include parts of the southwest Atlantic shelf edge and the inner shelf of much of the western Cape, and parts of the south coast and shelf and KwaZulu-Natal Bight (Figure 1).
Restored flows, improved bycatch and waste water management and further reductions of lethal shark control measures could improve ecological condition in parts of the KwaZulu-Natal Bight.
Improved bycatch management, and … measures to protect bathers from sharks using non-lethal measures could help improve ecosystem condition in KwaZulu-Natal.
Approach
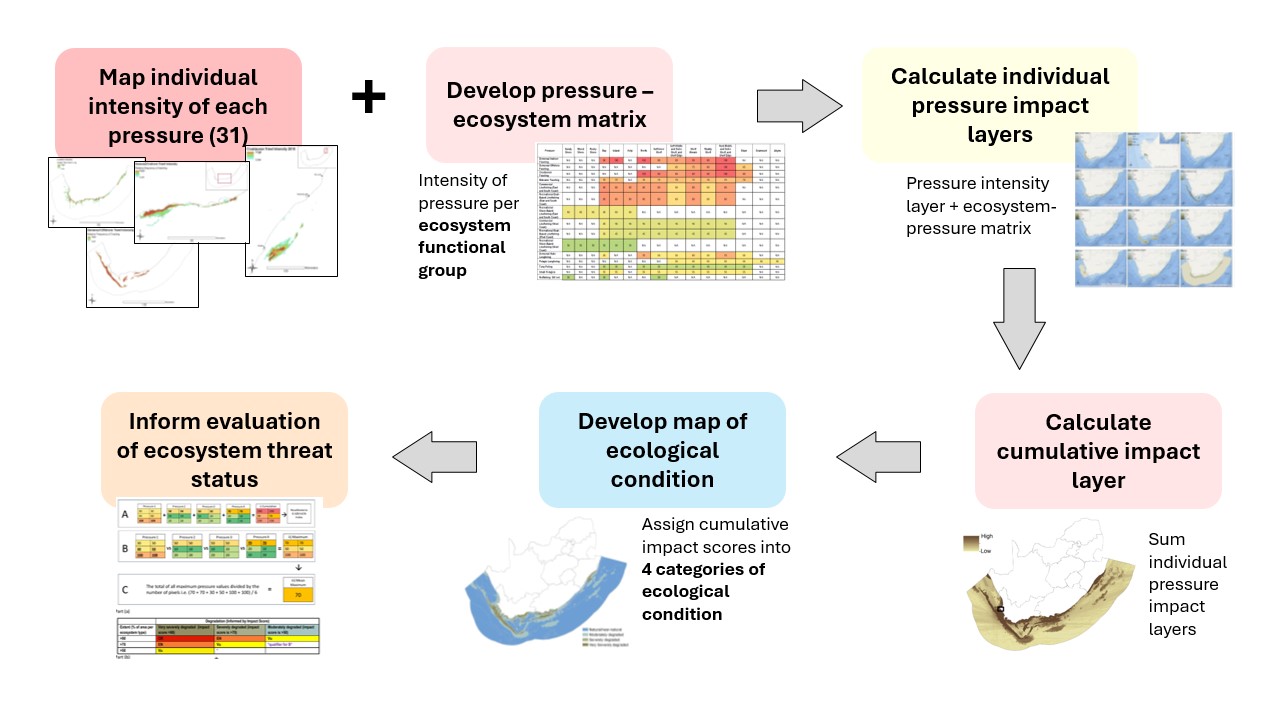
Ecological condition is estimated using a range of different approaches across realms, but is essentially the product of spatially representing the various pressures exerted on biodiversity. In the marine realm, a total of 31 mapped pressure layers were used to assess ecological condition (Sink et al. 2018 threat chapter) using an ecosystem pressure matrix. The ecosystem pressure matrix was developed using expert scoring supported by literature and the synthesis of information regarding the impacts of marine pressures (link to pressure section). A guided group consensus method was used to score “functional impact” and “recovery”, simplified from an existing method (Teck et al. (2010) for each pressure and Ecosystem Functional Group. Impact scores reflect the equal weighted average of the functional impact and recovery scores for different broad ecosystem groups per pressure. Condition of an ecosystem at a site (30 x30 m pixels) was classified based on the cumulative impact scores at that site.
Severity Extent Very severely modified(>90) Heavily /Severely modified (70-90) Moderately modified degraded (>50)
>90% CR EN VU
>70% EN VU
>50% VU
Technical documentation
Git repositories
Key publications
Majiedt, P.A. et al. 2019. Pressures on marine biodiversity. In Sink, K. et al. (eds),: 152–246. Pretoria, South Africa.
References
Recommended citation
Sink, K. 2025. Ecological condition: Marine realm. National Biodiversity Assessment 2025. South African National Biodiversity Institute. http://nba.sanbi.org.za/.