
Protected areas play an important role in conserving representative and healthy functioning wetland ecosystems to ensure the continued existence of species and ecosystem types. However, inland wetland types are severely under-represented and under-protected in South Africa, with nearly 80% of wetland ecosystem types categorised as Poorly Protected or Not Protected. Freshwater-associated restoration efforts strategically implemented within protected areas continue to increase their effectiveness. However, achieving national conservation goals requires these efforts be amplified through a comprehensive network of conservation measures across the broader landscape.
5%
of wetland extent
Well Protected
of wetland extent
Well Protected
10%
of 82 inland wetland types
Well Protected
of 82 inland wetland types
Well Protected
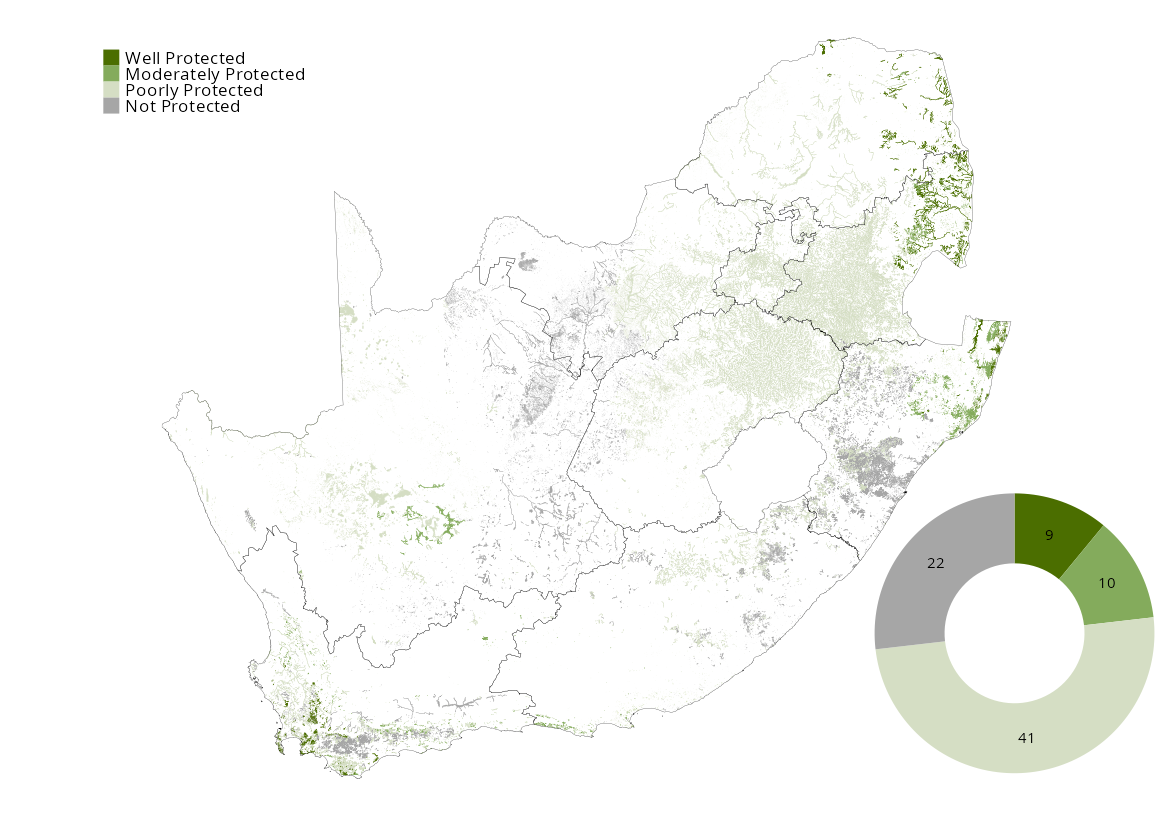
The proportion of South Africa’s total wetland extent under statutory protection (i.e. in categories1 recognised under the Protected Areas Act) at the time of this assessment is 23% (600 000 ha). Taking wetland ecological condition into consideration, approximately 5% of inland wetland ecosystem extent is Well Protected, 6% is Moderately Protected, 69% is Poorly Protected and 20% is Not Protected.
According to wetland type, 8 (10%) of inland wetland ecosystem types are Well Protected, 11 (13%) are Moderately Protected, 41 (50%) are Poorly Protected and 22 (27%) are Not Protected. Well Protected wetland ecosystem types are clustered within the Kruger National Park in eastern Mpumalanga, iSimangaliso Wetland Park World Heritage Site on the Maputaland Coastal Plain in KwaZulu-Natal, and across the Western Cape.
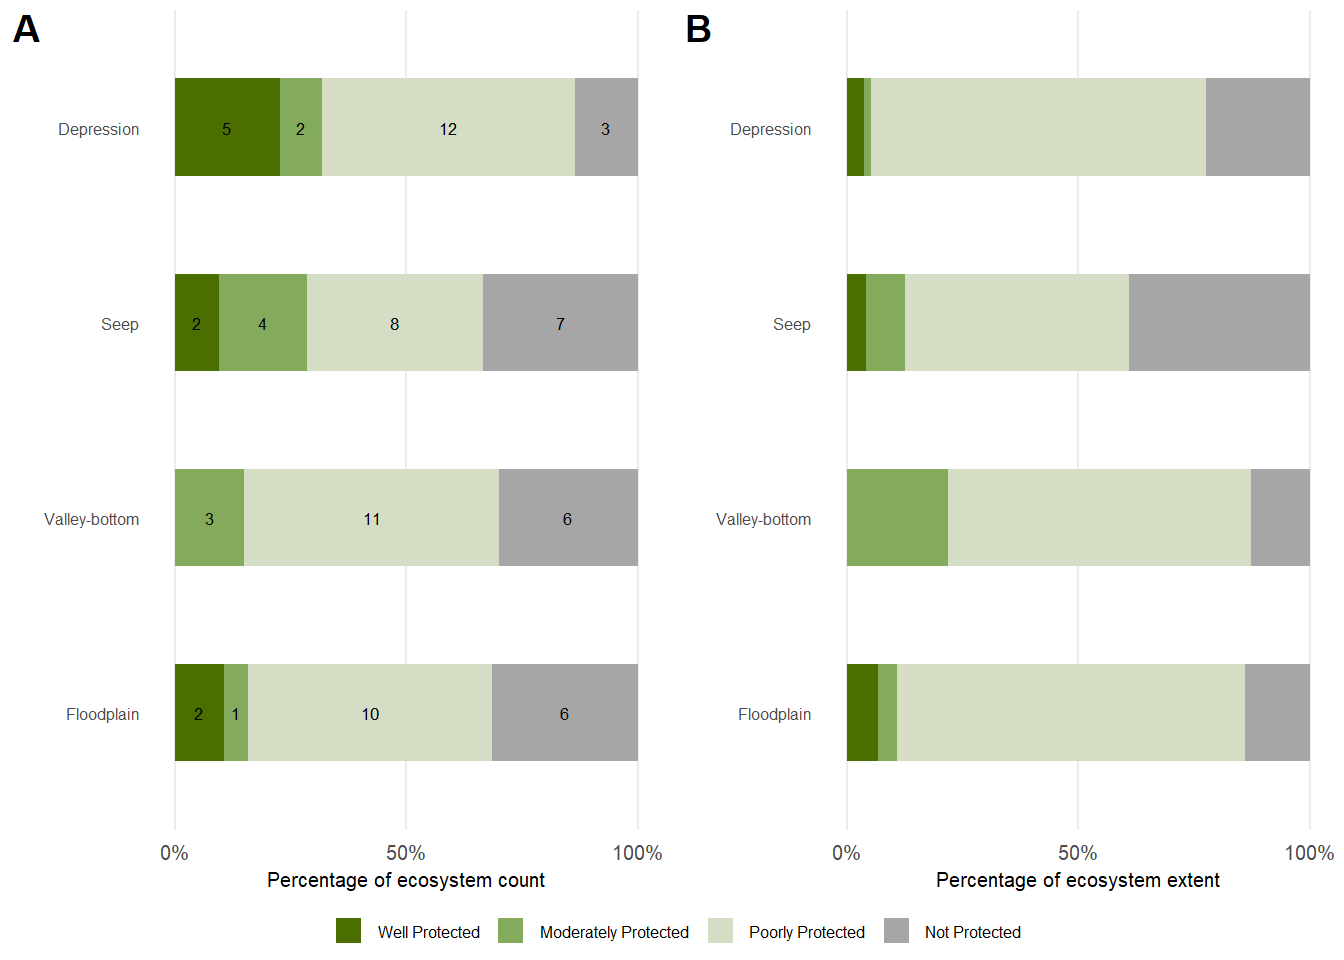
In terms of wetland hydrogeomorphic type, depression wetlands have the highest protection level, with 33% of depression wetland types and 37% of depression wetland extent considered to be Well Protected, while only 11% and 10% respectively of floodplain and seep wetland types are considered Well Protected. No unchannelled valley-bottom wetland types are considered Well Protected.
| Well Protected | Moderately Protected | Poorly Protected | Not Protected | ||
|---|---|---|---|---|---|
| Depression | Count | 5 | 2 | 12 | 3 |
| Extent (km2) | 277 | 115 | 5 548 | 1 714 | |
| Seep | Count | 2 | 4 | 8 | 7 |
| Extent (km2) | 203 | 423 | 2 393 | 1 935 | |
| Unchannelled valley-bottom | Count | 0 | 3 | 11 | 6 |
| Extent (km2) | 0 | 786 | 2 338 | 457 | |
| Floodplain | Count | 2 | 1 | 10 | 6 |
| Extent (km2) | 928 | 560 | 10 316 | 1 914 | |
Download the data here.
Intersection of ecosystem threat status and protection levels
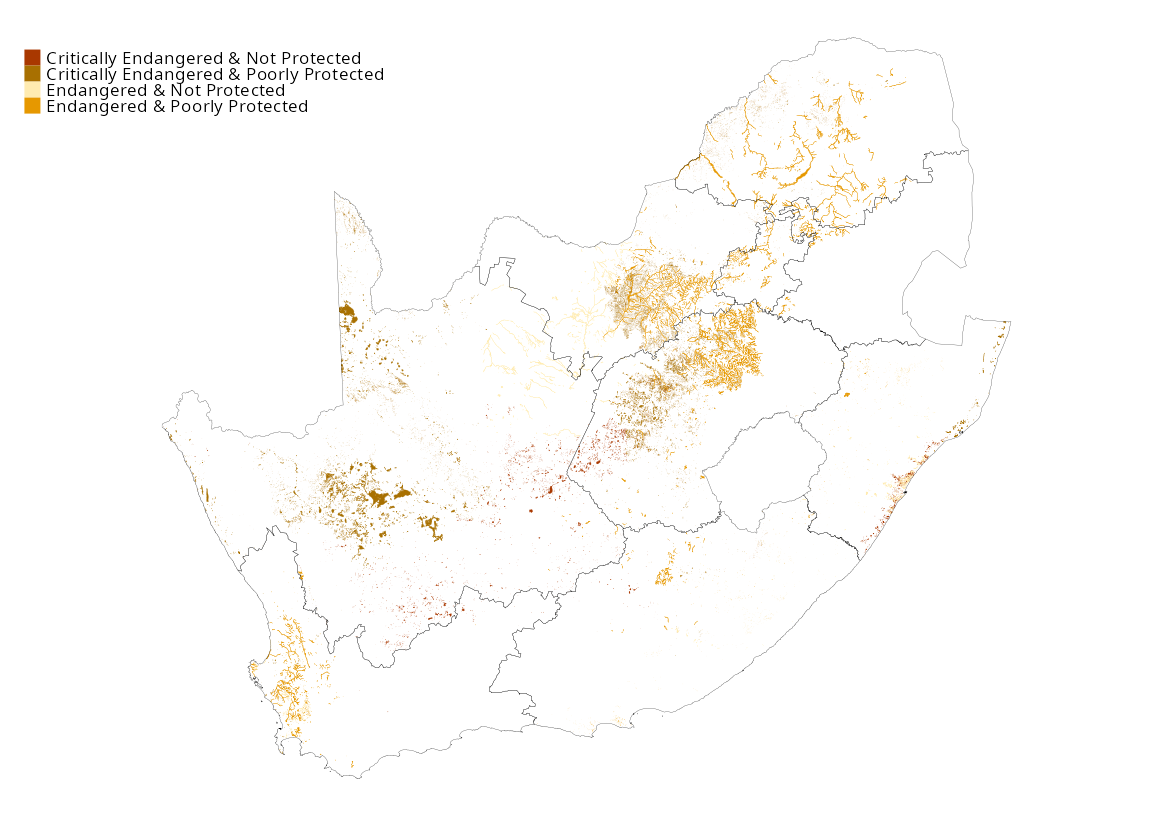
Combining the headline indicators provides an additional perspective on the status of wetland ecosystems. Although there has been positive progress in protecting inland wetland ecosystem types, the national protected area network could be strengthened to encompass a wider representation of South Africa’s inland wetlands and to afford protection to those that are Poorly Protected or Not Protected. Seventeen (20%) out of 82 inland wetland types are both highly threatened (i.e. Critically Endangered and Endangered) and under-protected (Not Protected or Poorly Protected). They are widespread, but found predominantly on the Highveld, along the eastern escarpment, in the Cape Fold Mountains and the arid Northern Cape.
| Not Protected | Poorly Protected | Moderately Protected | Well Protected | Total | |
|---|---|---|---|---|---|
| Critically Endangered | 2 | 9 | 1 | 3 | 15 |
| Endangered | 8 | 10 | 3 | 1 | 22 |
| Vulnerable | 7 | 12 | 2 | 3 | 24 |
| Least Concern | 5 | 10 | 4 | 2 | 21 |
| Total (n) | 22 | 41 | 10 | 9 | 82 |
Important note on work in progress
The wetland ecosystem protection level analysis is built on a robust interim wetland ecosystem typology. However, the refinement of the national wetland ecosystem typology was still underway at the time of this assessment. This ongoing process to refine the interim typology into more detailed, validated subtypes is being undertaken in collaboration with multiple research partners. It will soon result in minor adjustments and an updated assessment, which will be widely communicated.
Approach
Ecosystem protection level is a headline indicator of the National Biodiversity Assessment. It measures the degree to which ecosystem types are represented within South Africa’s protected area network1. Read more about this indicator on the ecosystem protection level explainer page.
Key input layers include the South African protected areas database2, the wetland ecosystem types, and wetland ecological condition assessment.
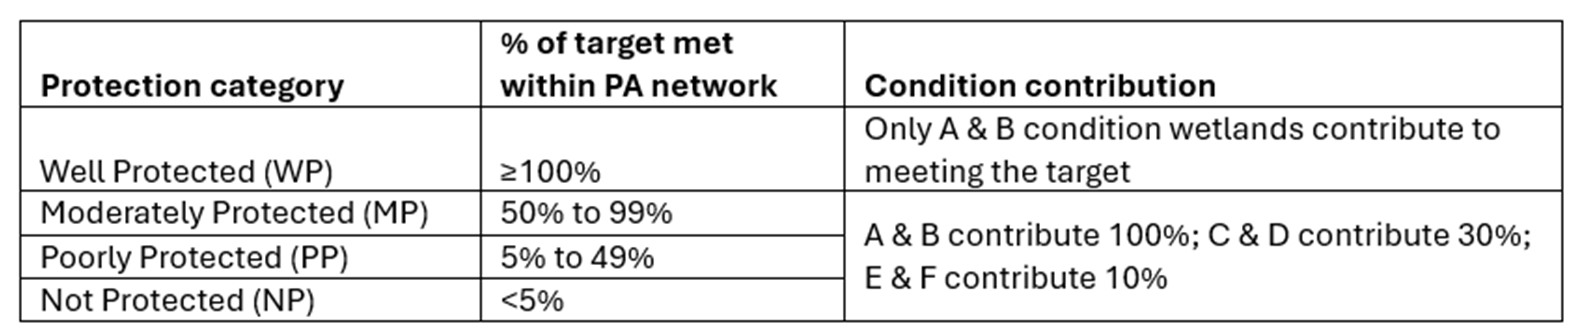
While the 2018 assessment used a standard 20% target for freshwater3 ecosystems, the current protection level target was adjusted to 30% in line with Target 3 of the Global Biodiversity Framework. This target is applied to each of the 82 inland wetland ecosystem types. Importantly, the current ecological condition of the wetland within the protected area is taken into consideration in the calculation, ensuring that effectiveness is accounted for. At least 30% of each inland wetland ecosystem type (i.e. the ecosystem target) needs to be in a natural or near natural ecological condition (ecological class A or B) to qualify in the Well Protected category. If this target was not met, the ecosystem type is categorised as Moderately Protected or lower, meaning that good condition wetlands contribute more to meeting protection level targets than poor condition wetlands.
Ecosystem types were assigned to one of four categories based on the percentage of the protection target met within the protected areas network, and scaled by ecological condition (Table 4): Well Protected: 100% (or more) of a wetland ecosystem type’s target falls within the protected area network; but only wetlands in an A and B condition are considered to contribute; Moderately Protected: 50% to 99% of a wetland ecosystem type’s target falls within the protected area network; and wetlands in an A and B condition contribute 100%, wetlands in a C and D condition contribute 30%, while E and F condition wetlands contribute only 10%; Poorly Protected: 5% to 49% of a wetland ecosystem type’s target falls within the protected area network; and A and B condition wetlands contribute 100%, C and D condition wetlands contribute 30%, E and F condition wetlands contribute 10%; Not Protected: less than 5% of a wetland ecosystem type’s target falls within the protected area network; and A and B condition wetlands contribute 100%, C and D condition wetlands contribute 30%, E and F condition rivers contribute 10%.
Changes in ecosystem protection level results since the 2018 assessment reflect revised targets and improved methodologies for global and national alignment, alongside genuine changes in protection and updates to inland wetland ecological condition and mapping of wetland extent.
Technical documentation
Code repository
Skowno, A.L. 2025. SANBI-NBA Wetland ecosystem protection level [Source code]. GitHub repository available at https://github.com/askowno/EPL_wet
Related publications and supporting information
Convention on Wetlands (2025). Other effective area-based conservation measures (OECMs) for the conservation and wise use of wetlands. Briefing Note 14. Gland, Switzerland: Secretariat of the Convention on Wetlands. DOI: 10.69556/strp.bn14.25.eng
Harris, L.R., Skowno, A.L., Holness, S.D., Sink, K.J., van Niekerk, L., van Deventer, H., Smith-Adao, L., Job, N., Khatieb, S., Monyeki, M. (in review). Indicators for tracking progress in effective, representative ecosystem protection.
Recommended citation
Job, N., Skowno, A., Currie, J., Mayekiso, P., & Jay, J. 2026. Wetland ecosystem protection level: Freshwater (inland aquatic) realm. National Biodiversity Assessment 2025. South African National Biodiversity Institute. http://nba.sanbi.org.za/.
References
1. Government of South Africa. 2003. National environmental management: Protected areas (act 57 of 2003).
2. South African Protected Areas Database. 2024. SAPAD_2024_IR_Q4.
3. Roux, D.J. et al. 2008. Improving cross-sector policy integration and cooperation in support of freshwater conservation. Conservation Biology 22: 1382–1387.
Notes
Includes Forest Nature Reserve, Forest Wilderness Area, Marine Protected Area, Mountain Catchment Area, National Park, Nature Reserve, Protected Environment, Special Nature Reserve, World Heritage Site, as well as the sub-categories associated with each of these sites.↩︎