
Monitoring genetic diversity using indicators
Genetic diversity underpins all biological diversity, playing a key role in individual fitness (an organism’s ability to survive and reproduce), species’ ability to adapt to changing environments, and overall ecosystem resilience. The genetic diversity of many wild species has declined in recent decades and greater declines are projected through ongoing habitat loss and population size reductions. Local extinctions, reduced population sizes and disruption of genetic connectivity mean that many of the populations that exist today have insufficient genetic diversity to persist in the long term.
Core Conservation Genetic Principles
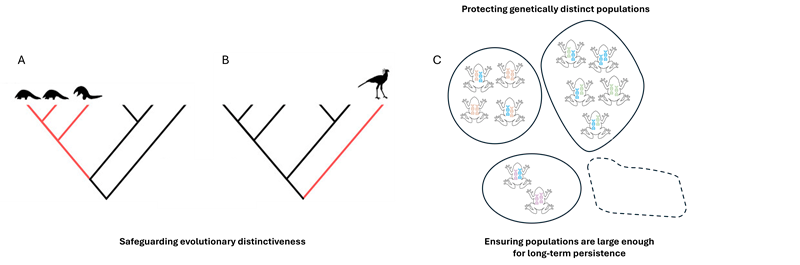
Conservation monitoring is guided by key principles (Figure 1), which together capture genetic diversity at multiple scales:
Safeguard evolutionary distinctiveness – preserves unique branches of the tree of life.
Protect genetically distinct populations – maintains adaptive potential within species.
Ensure populations are large enough for long-term persistence – reduces loss of diversity through genetic drift1 and inbreeding.
In line with these principles, South Africa has adopted four genetic indicators from the Kunming-Montreal Global Biodiversity Framework, which can be based on direct genetic data or on proxies (when genetic data are not available; namely the Ne 500 and PM indicators).
South Africa’s Ne 500 and PM indicator scores
of 90 species assessed have
Populations Maintained (PM)
of 61 species assessed have
Populations with Ne greater than 500
As part of a global study testing the feasibility of reporting on the PM and Ne 500 indicators1, 126 South African species were assessed, allowing for national indicator values to be quantified. Of these, 90 species had sufficient data to quantify the PM indicator, and 61 species had sufficient data to quantify the Ne 500 indicator. South reported a PM value of 0.95 and Ne 500 value of 0.42. This indicates that, while South Africa has maintained the majority of its species’ populations, they are smaller than what is needed to ensure their long-term persistence and the overall adaptive potential of the species (key message B3). While this first assessment incorporated a relatively small number of species, the species included were from a wide variety of taxonomic groups, ecosystems, distributions and conservation statuses.
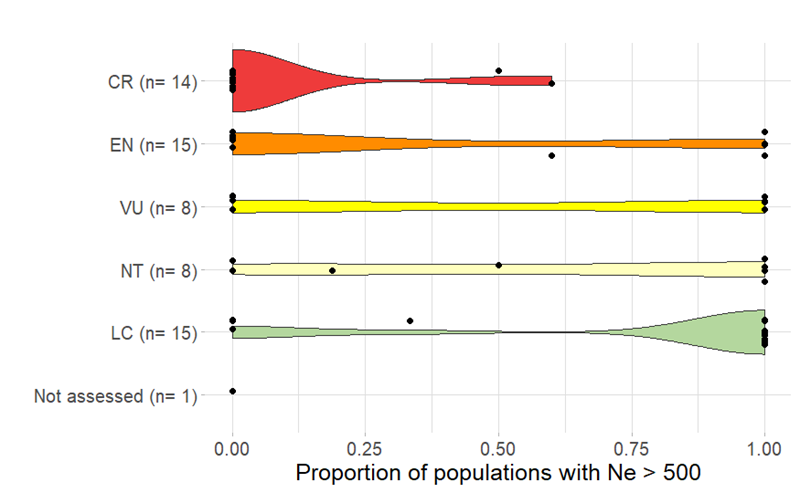
Importantly, these national metrics can be disaggregated in various ways, such as by taxonomic group (Table 1) or conservation status (Figure 2), to explore patterns and trends across different biodiversity components, similar to species and ecosystems assessments.
| Taxonomic Group | PM | Ne 500 |
|---|---|---|
| Amphibian | 0.92 +/- 0.17 | 0.13 +/- 0.25 |
| Angiosperm | 0.83 +/- 0.28 | 0.06 +/- 0.19 |
| Bird | 1.00 +/- 0.00 | 0.33 +/- 0.47 |
| Fish | 1.00 +/- 0.00 | 0.30 +/- 0.48 |
| Mammal | 0.99 +/- 0.04 | 0.61 +/-0.48 |
| Reptile | 0.87 +/- 0.25 | 1 |
Of concern is that even Least Concern and Near Threatened taxa have indicator scores < 1 (Figure 2), indicating a loss of diversity that has gone undetected using other measures of extinction risk.
To better understand the genetic health of South African biodiversity, efforts are underway to expand this work across complete taxonomic groups (see Mammal Red List page).
Tracking the expected loss of phylogenetic diversity
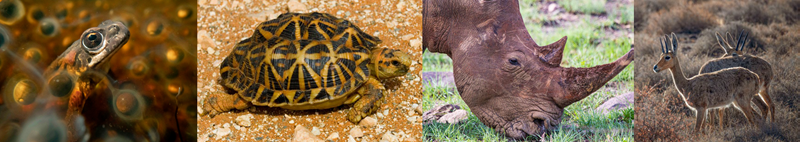
A case study on South Africa’s amphibians and reptiles
South Africa is home to exceptionally rich and evolutionarily unique biodiversity, the loss of which would represent a significant erosion of the country’s evolutionary heritage. Using comprehensive Red List assessments together with detailed evolutionary (phylogenetic) trees, researchers can estimate how much of this evolutionary heritage could be lost if threatened species go extinct – a metric known as Expected Loss of Phylogenetic Diversity – the proportion of evolutionary history likely to be lost if currently threatened species go extinct.
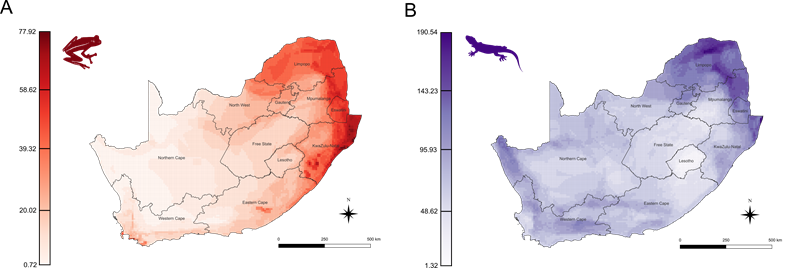
In a recent case study2, this approach was applied to South Africa’s amphibians and reptiles, both of which have exceptionally high levels of endemism (around 50%). By integrating extinction risk data with measures of phylogenetic diversity (PD), researchers found that, without conservation action, about 6.5% of amphibian PD and 5% of reptile PD could be lost over the next 50 years (Figure 3).
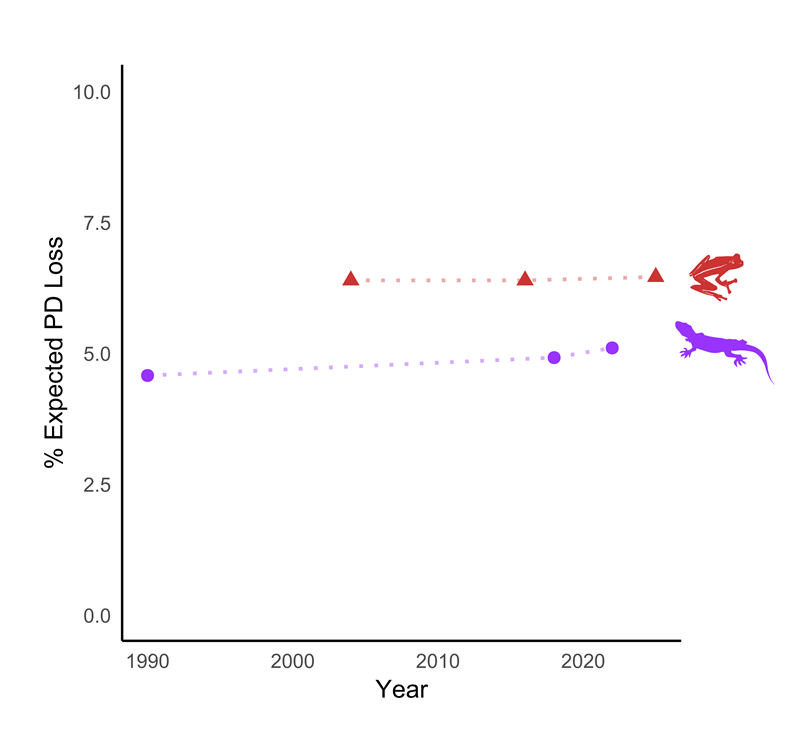
Importantly, areas rich in PD did not always coincide with regions of high species richness, revealing new priorities for conservation to protect large portions of South Africa’s evolutionary heritage (Figure 4).
This study provides a national framework for monitoring phylogenetic biodiversity and its expected loss, aligned with global biodiversity monitoring goals. It demonstrates an approach that can be extended to other taxonomic groups, helping ensure that conservation strategies safeguard not only species, but also the deep evolutionary lineages and adaptive potential that make South Africa’s biodiversity globally unique.
Developing the EDGE indicator for South Africa
In South Africa, the calculation of EDGE indices is underway for all vertebrate groups. Preliminary insights suggest that species such as the geometric tortoise (Psammobates geometricus) and sungazer (Smaug giganteus)are likely to rank high for reptiles under the EDGE framework. Once completed, these results will enable targeted conservation planning, helping to prioritize species that contribute disproportionately to the country’s evolutionary heritage.
Available genetic tools and initiatives
As technology advances and the cost of molecular processing continues to decrease, monitoring the genetic health of species and their populations through time is becoming increasingly feasible. South Africa utilizes a growing suite of genetic tools, including:
Forensic genetics read more here — identifying illegally traded wildlife products to enforce conservation laws.
Biobanking read more here — long-term preservation of genetic material from threatened species for future research and restoration.
DNA barcoding read more here— building reference libraries for species identification and monitoring.
Environmental DNA (eDNA) — detecting species and tracking biodiversity changes through genetic traces in soil, water, or air samples.
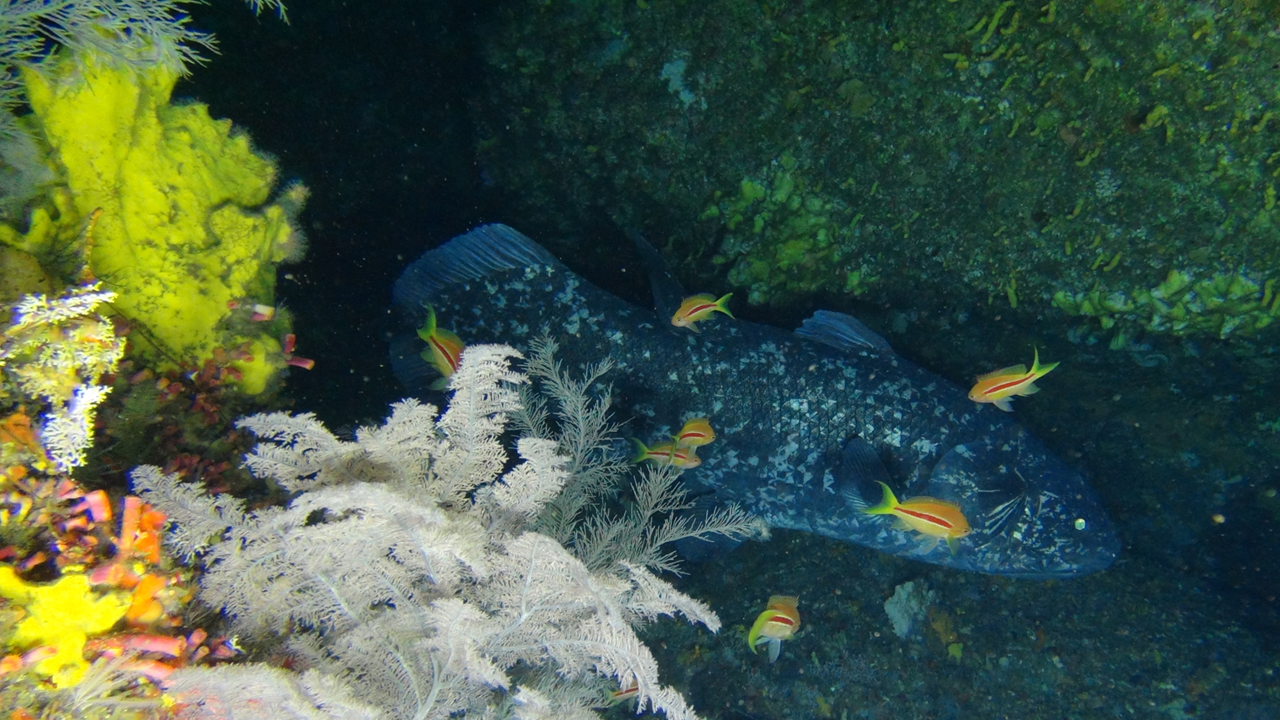
The Deep Connections project funded through the African Coelacanth Ecosystem Programme pioneered the first detection of coelacanths using environmental DNA4 providing new methods to support conservation assessment and monitoring for this rare and ancient lineage of fishes. © ACEP Deep Connections, Kerry Sink
Technical documentation
Populations Maintained & Ne 500 indicator repositories
Code repository: github.com/AliciaMstt/GeneticIndicators/blob/main/4_plots_by_country
Data repository: DRYAD
Expected Loss of Phylogenetic Diversity repositories:
- Data and Code: Figshare
Recommended citation
da Silva, J.M., Nieto Lawrence, J.A., & Tolley, K.A. 2025. Genetic Diversity. National Biodiversity Assessment 2025. South African National Biodiversity Institute. http://nba.sanbi.org.za/.
References
Notes
Genetic drift is a random change in the genetic makeup of a population from one generation to the next that happens by chance.↩︎