The NBA has four headline indicators, providing information on the threat status and protection level of ecosystems and species.
The threat status indicators use established IUCN Red List of Ecosystems and Red List of Threatened Species assessment frameworks. The risk of collapse (ecosystems) or extinction (species) is evaluated across all realms and for taxonomic groups for which sufficient data exist. The protection level indicators (developed as part of the NBA) reflect how well species and ecosystem types are represented in the protected area network.
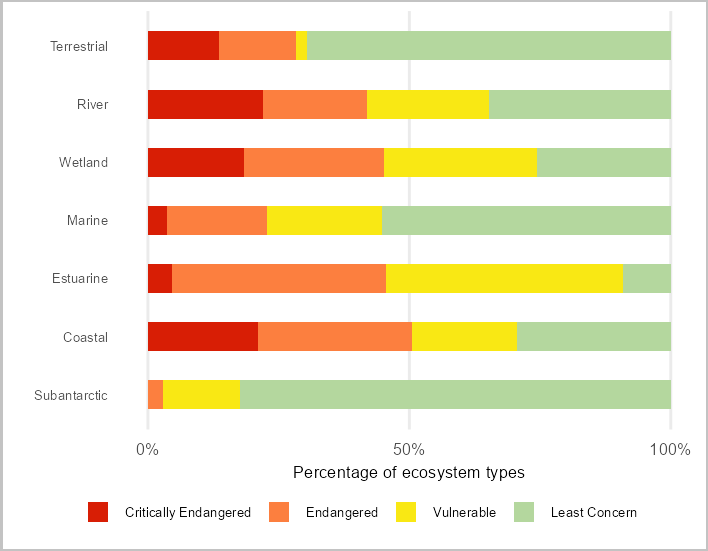
Ecosystem threat status: Almost half of the 986 ecosystem types assessed in the NBA 2025 are threatened. Estuaries, wetlands, rivers and the coast have the highest proportion of threatened ecosystem types.
Click on images to enlarge
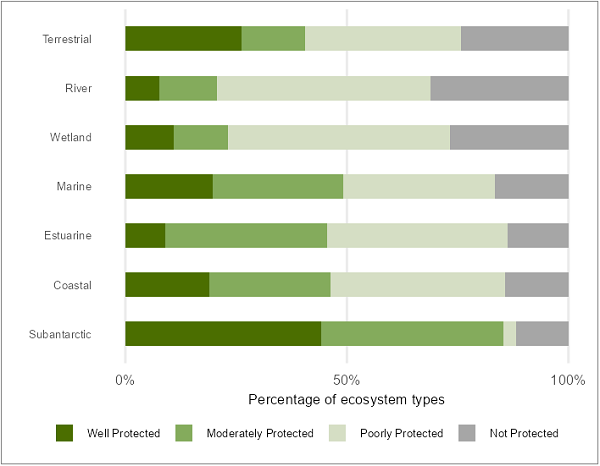
Ecosystem protection level: Over three-quarters of ecosystem types are represented in the current protected area network, leaving 24% in the Not Protected category. River, wetland and estuary types have the lowest levels of protection.
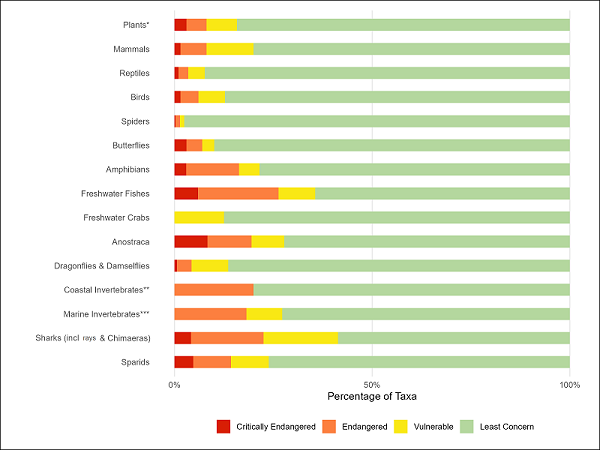
Species threat status: Of 20 248 plant species assessed, 16% are threatened. Of 5 226 animal species assessed, 10% are threatened. The most threatened taxonomic groups are freshwater fishes and cartilaginous fishes (sharks, rays and chimaeras).
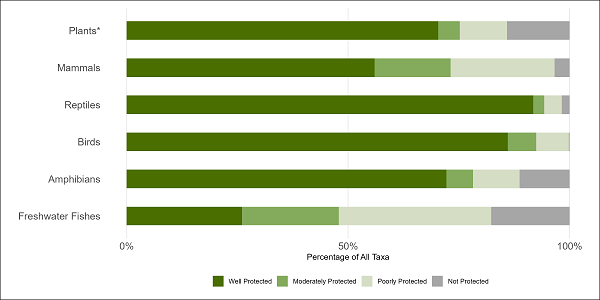
Species protection level: Almost 70% of plant species are Well Protected (based on a random sample of 900 taxa). All mammal, reptile, bird, amphibian and freshwater fish species were assessed and overall 77% are Well Protected.