
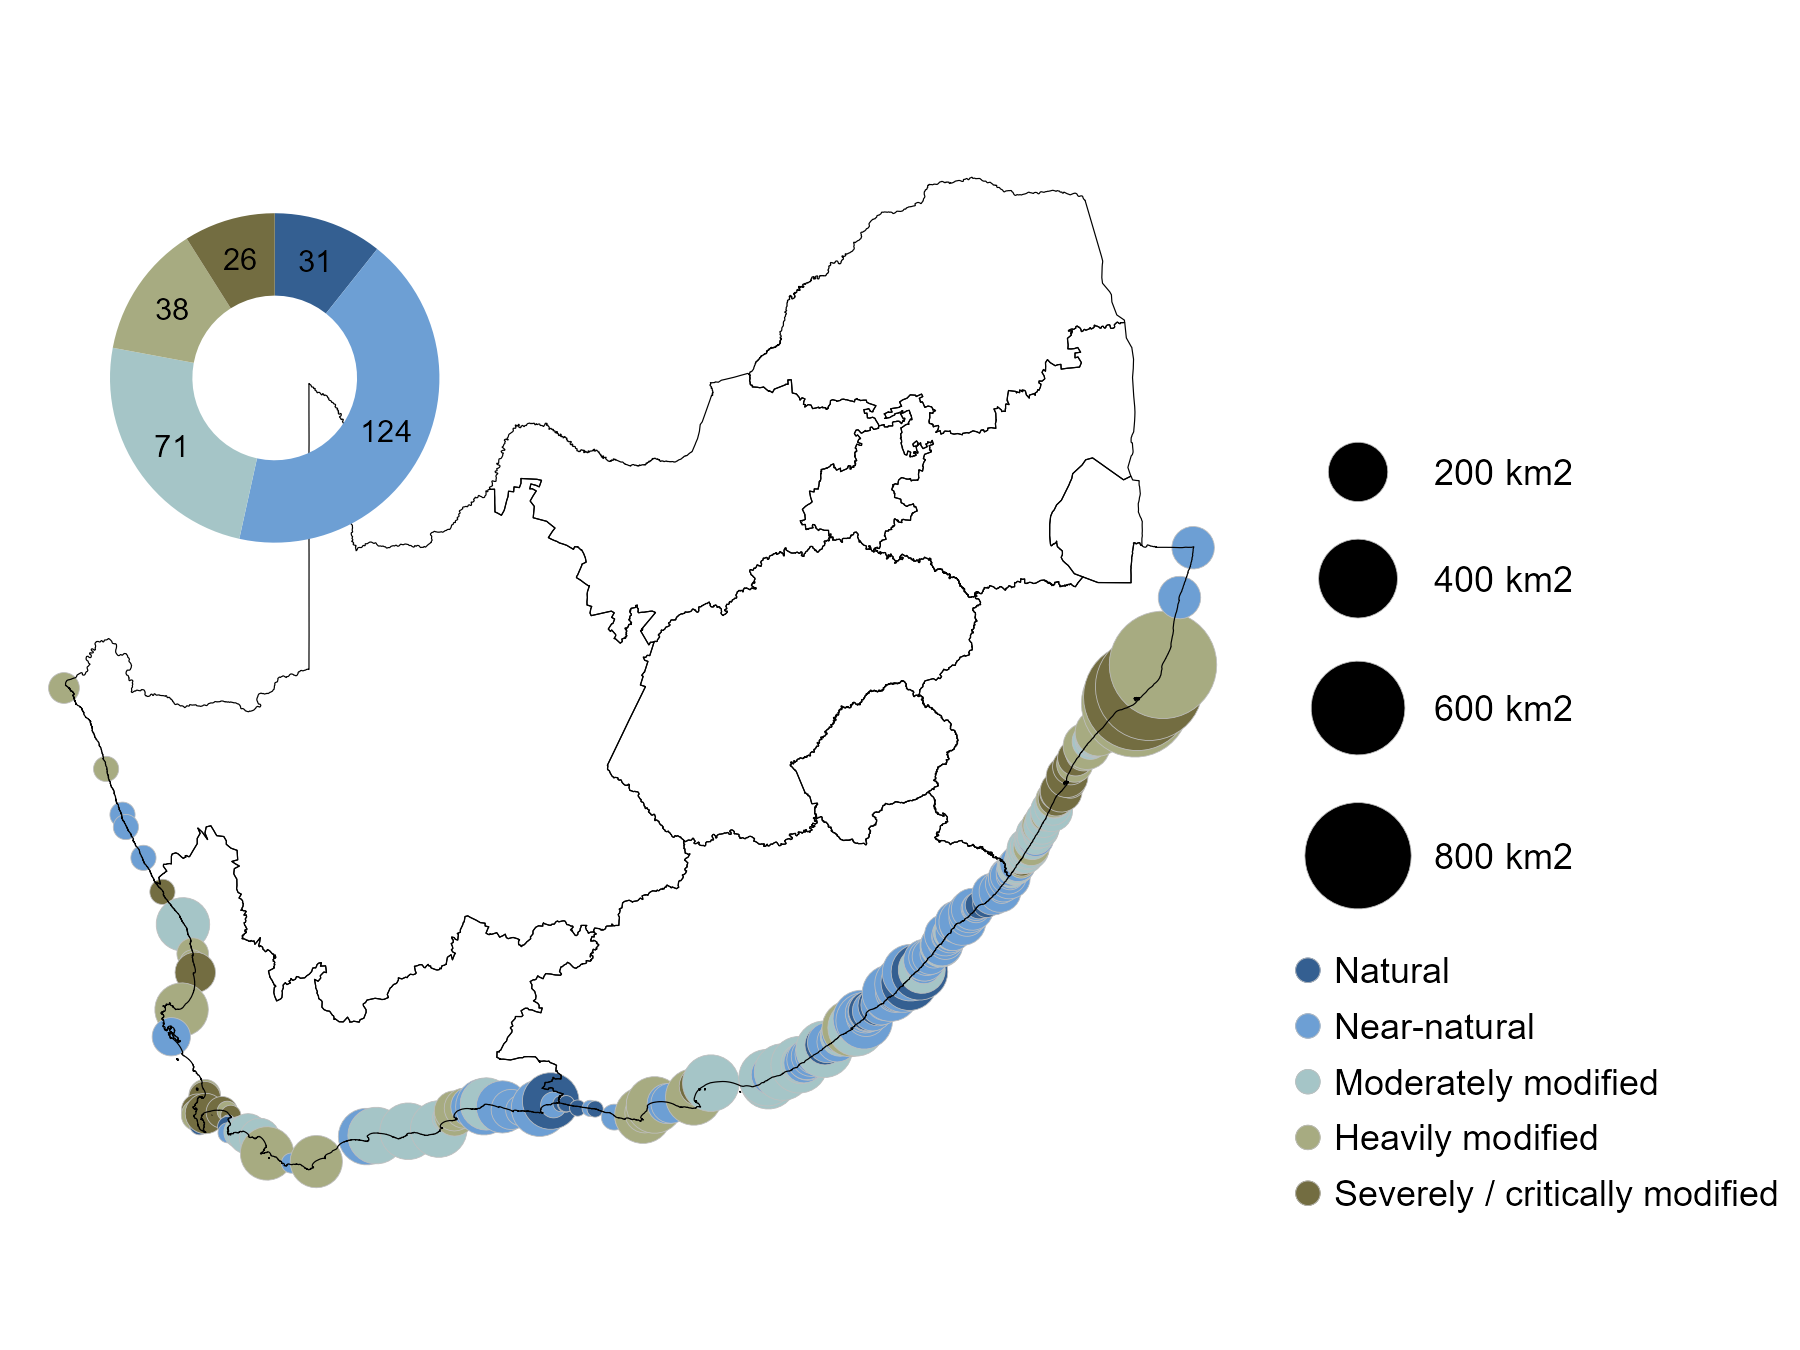
More than 53% of South Africa’s estuaries are relatively healthy, but this amounts to only 18% of total estuarine extent, comprised mostly of small estuaries. Since 2018, the number of estuaries in natural/near natural condition declined by 11% and the extent of heavily modified estuarine area has increased by 13%. Important ecological processes are under severe pressure and with resultant reductions in ecosystem productivity, food security, fisheries livelihood, property values and recreational enjoyment.
53%
of estuaries
Natural/near natural
of estuaries
Natural/near natural
22%
of estuaries
Heavily to critically modified
of estuaries
Heavily to critically modified
18%
of estuarine area
Natural/near natural
of estuarine area
Natural/near natural
70%
of estuarine area
Heavily to critically modified
of estuarine area
Heavily to critically modified
South African estuaries differ considerably around the coast in terms of their physicochemical and biotic characteristics. The climatic range across the four biogeographic regions has resulted in large differences in human settlement patterns and with them the nature of estuarine utilisation1. The first step in proactive planning and effective management of estuaries is to understand how healthy they are.
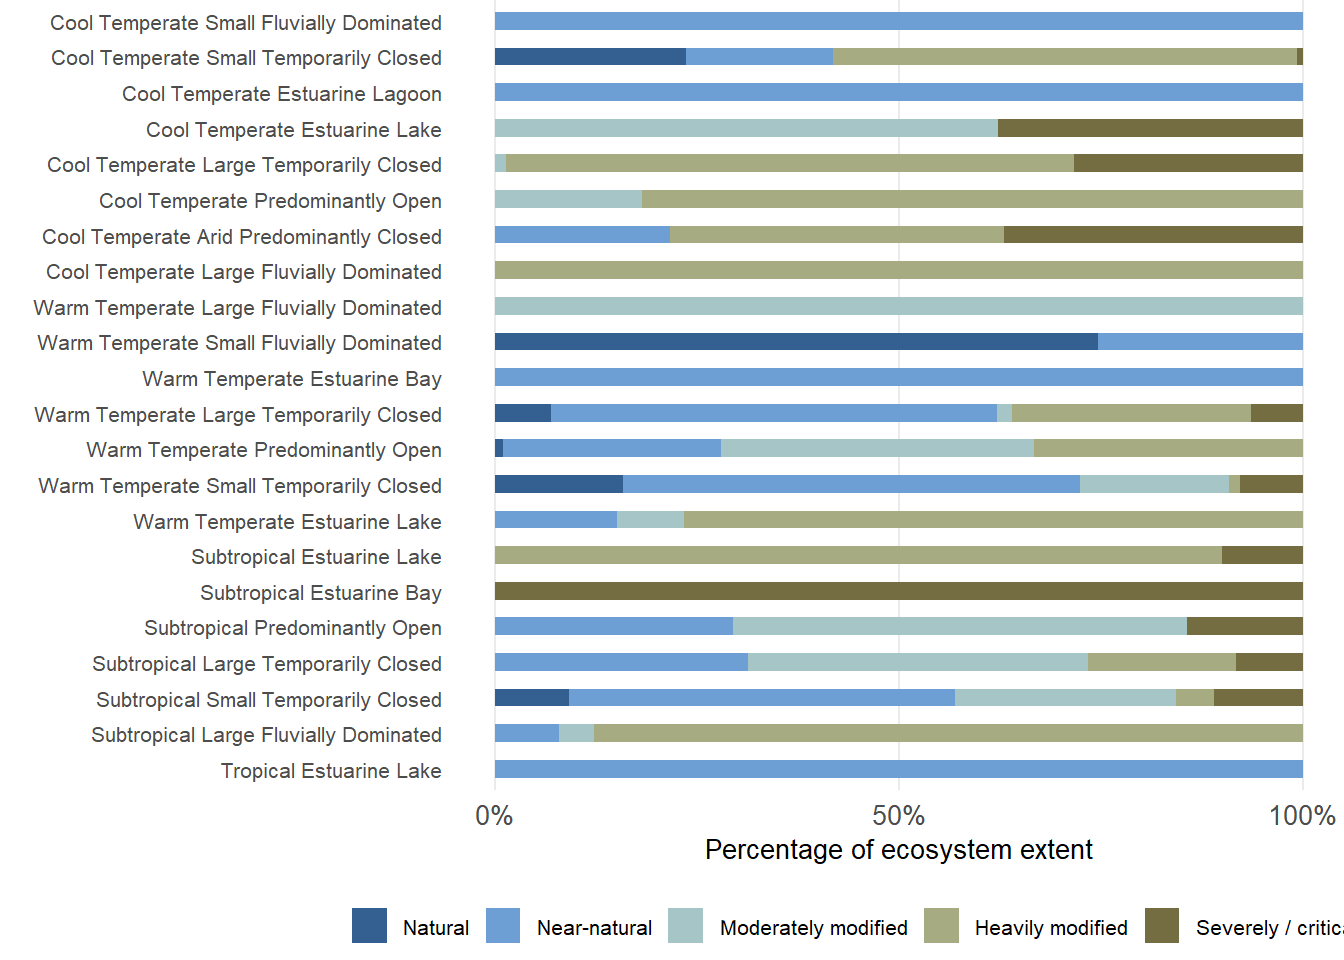
The 2025 assessment determined that 11% of estuaries in South African are considered to be in a natural state (A category), 43% in a near natural state (B category), 28% in a moderately modified state (C category), 8% in a heavily modified state (D category), and 7% in a severely/critically modified state. Estuaries in natural and near natural state are mainly located in the Warm Temperate and Subtropical regions, while the Cool Temperate region is characterised by estuaries in a heavily to severely/critically modified state. That analysis is biased towards the state of the large number of small estuary types occurring along the South African coast. When analysed according to estuarine area rather than the number of estuaries, the majority (70%) of estuarine area is in a heavily modified state or worse, and only about 1% and 18% in a natural and near natural state, respectively. The latter are mainly located in the Warm Temperate and Subtropical regions. An additional 12% are in a moderately modified state. Part of this result is an artefact of the ‘Lake St Lucia effect’. This Subtropical system accounts for more than half of South African estuarine extent and is currently classified as being in a heavily modified state.
The 2018 assessment showed that 21% of estuaries in a natural state, 40% in a near natural state, 20% in a Moderately modified state, 12% in a heavily modified state, and 7% in a severely /critically modified state. By estuarine area, the majority of estuarine area (63%) was in a heavily modified state or worse, and only about 5% and 17% in a natural and near natural state, respectively.
The Cool Temperate region had the highest number of estuaries in a degraded condition as it supports estuarine habitat mainly in the severely to critically modified categories, especially the large to small temporarily open systems near Cape Town and other coastal urban centres. The Warm Temperate region, on the other hand, was characterised by a large number of estuaries in a natural to near natural condition, possibly due to the undeveloped nature of large parts of the coast in this biogeographic region. The Subtropical region had the second-highest number of estuaries in a degraded state, mainly due to pollution, very high fishing pressure (illegal gillnetting), direct habitat loss, sand mining, and intensive sugar cane farming in the catchments and estuary functional zone.
From an estuarine ecosystem perspective, the Cool Temperate biogeographical region had the highest percentage of ecosystem types in a heavily to severely/critically modified state with Large Fluvially Dominated, Large Temporarily Closed, Arid Predominantly Closed, Small Temporarily Closed and Estuarine Lakes reflecting key pressures such as flow reduction, pollution and fishing pressure of the region.
NoteBox 1. Estuarine Lakes are in crisis requiring urgent management interventions prioritised within an ‘Estuarine Lakes Strategy’
This group of estuaries has seen extensive infrastructure development in the estuary functional zone, substantial flow reduction, nutrient pollution, harmful algal blooms, overfishing (especially gillnetting) and are subjected to artificial breaching / mouth manipulation. In addition, the lakes are highly vulnerable to climate change. These impacts have reduced their ability to provide key services such as flood regulation, nutrient cycling, nursery habitat, and have compromised recreational and tourism values.
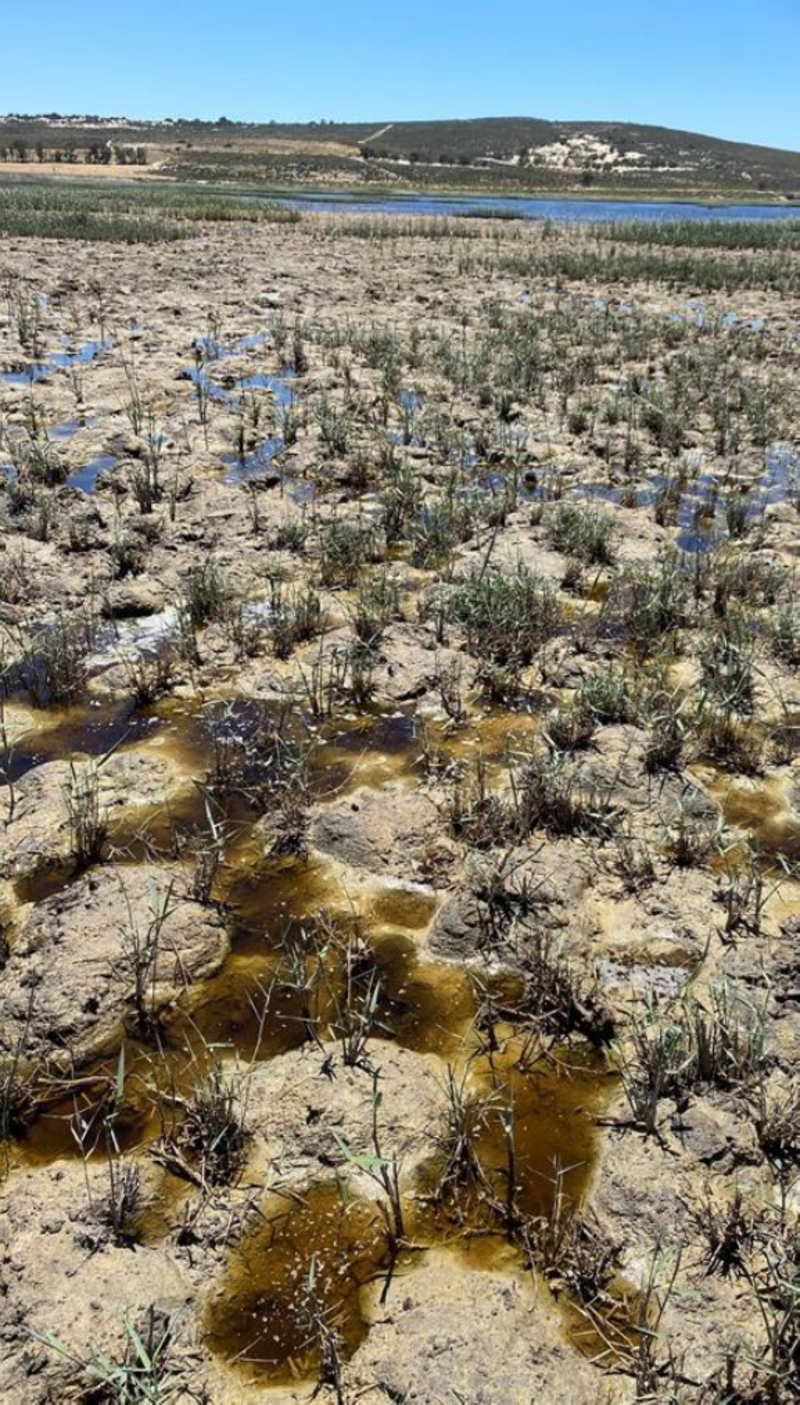
The first record of estuarine lake acidification in South Africa was observed the last ten years. The Verlorenvlei Ramsar site’s pH levels declined to 3 (similar to vinegar) during the period 2016-2018 due to a regional drought compounded by over-abstraction of surface and groundwater, causing the drying out of the lake and acidification of soils. This caused the local extinction of invertebrates, fish and bird life. Though lake levels have recovered over the past three years, lake pH has still fluctuated between 4 (summer) and 7 (winter). It may take decades for the Ramsar site to fully recover, given the altered soil chemistry in the lake and surrounding wetlands.
To ensure ecosystem benefits and future climate change resilience, a long-term ‘Estuarine Lakes Strategy’ is needed to restore habitat, improve water quantity and quality, reduce pressure on resources and increase protection levels.
In the Subtropical biogeographical region, the highest number of ecosystem types in a heavily to severely/critically modified state are the Estuarine Lakes, Estuarine Bay, and Large Fluvially Dominated functional groups reflecting habitat transformation, pollution and fishing pressure of the region. In the Warm Temperate region, the Estuarine lakes reflect significant modification due to development in the estuarine functional zone, flow reduction and artificial breaching. In addition, Predominantly Open and Large Temporarily Open estuaries are also significantly modified. None of the types in the Tropical biogeographical region is in a severely modified state.
| Natural | Near-natural | Moderately modified | Heavily modified | Severely / critically modified | ||
|---|---|---|---|---|---|---|
| Cool Temperate | No. estuaries | 2 | 8 | 4 | 11 | 8 |
| Extent (km2) | 10 | 119 | 327 | 506 | 293 | |
| Percentage (%) | 1 | 9 | 26 | 40 | 23 | |
| Warm Temperate | No. estuaries | 20 | 64 | 23 | 12 | 5 |
| Extent (km2) | 995 | 3 877 | 2 200 | 1 229 | 134 | |
| Percentage (%) | 12 | 46 | 26 | 15 | 2 | |
| Subtropical | No. estuaries | 9 | 50 | 44 | 15 | 13 |
| Extent (km2) | 184 | 2 084 | 1 909 | 2 315 | 2 107 | |
| Percentage (%) | 2 | 24 | 22 | 27 | 24 | |
| Tropical | No. estuaries | 0 | 2 | 0 | 0 | 0 |
| Extent (km2) | 0 | 163 | 0 | 0 | 0 | |
| Percentage (%) | 0 | 100 | 0 | 0 | 0 | |
Overall, a significant number of the estuaries in South Africa are in excellent to good health, although these are mostly small systems in rural areas with few pressures. These systems tend not to be as resilient to change as large estuaries, primarily due to their small size and higher residence time brought about by limited tidal exchange. This is one of the key reasons for the poor condition of urban systems.
Larger systems, which are important as fish nursery grounds and of higher economic and ecological importance, are mostly in declining health due to indirect pressures from the catchment and direct pressures such as development in the estuary functional zone and fishing. Most of the estuarine extent in South Africa is in a modified moderately to heavily modified state, and there is a risk that this percentage could increase further if appropriate management actions are delayed.
The St Lucia Lake system accounts for more than half of the estuarine extent in South Africa and it is in relatively poor condition. Fortunately, however, the St Lucia and uMfolozi systems are in the process of being restored, and an adaptive management and monitoring programme has been initiated to assist with the long-term recovery of this World Heritage Site.
Monitoring of both abiotic and biotic parameters is seen as fundamental to validating the findings of the condition assessment. To benchmark the findings, monitoring also needs to cover the full spectrum of near-natural to heavily degraded estuaries in all four bioregions following the standardised methods developed for flow requirement studies. Ideally, research and assessment should be underpinned by modelling studies that encompass the functional linkages between ecosystem components and overwhelming pressures on the environment, such as climate change and ocean acidification. Such modelling studies can provide the evidence needed for setting realistic targets for resource use, and can also underpin better long-term resource planning.
Approach
Assessment of the condition of South African estuaries was based on the Estuarine Health Index (EHI) developed for South Africa’s ecological flow requirement studies2,3. The EHI considers both abiotic and biotic components, namely hydrology, hydrodynamics and mouth condition, water chemistry, sediment processes, microalgae, macrophytes, invertebrates, fish and birds (Figure 4). Both abiotic and biotic variables are included because the exact relationships between them are often not well understood and because the biotic responses to specific abiotic variables generally occur after a lag period6.
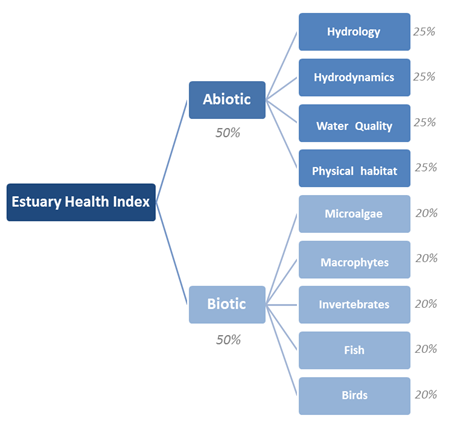
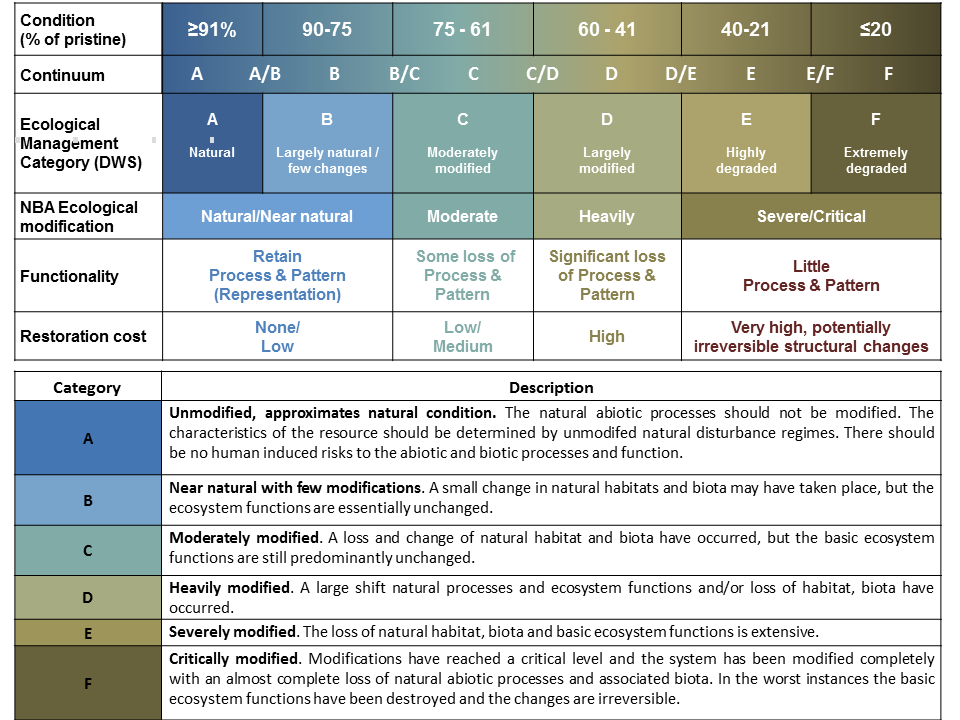
The approach requires that a multidisciplinary group of estuarine scientists assesses the health of a particular estuary in a workshop setting and is based on their collective understanding of likely impacts affecting that system. Available information and expert knowledge are used to build a ‘picture’ of the natural state of an estuary and the changes that have occurred under present conditions. For each of the components (abiotic and biotic), the change in condition is estimated as a percentage (0 – 100%) of the natural state. Scores are weighted (25% for each abiotic and 20% for each biotic component) and aggregated (50:50) to provide an overall score that reflects the present health of the system as a percentage of that under natural conditions. The index score in turn corresponds to an Ecological Management Category to describe the health of the estuaries using six categories, ranging from natural (A) to critically modified (F) (Table 3). These in turn have been cross walked to the NBA condition assessment categories.
To develop a clear understanding of the status of estuarine health within South Africa, large complex systems such as the Lake St Lucia Estuary were disaggregated into separate sections, namely Lake St Lucia and the uMfolozi Estuary. Similarly, the uMhlathuze Estuary and Richard’s Bay Harbour were evaluated separately. Consequently, the country-wide health assessment was conducted for a total of 290 estuaries.
Technical documentation
Key Publications
Van Niekerk, L., Adams, J.B., Lamberth, S.J., MacKay, C.F., Taljaard, S., Turpie, J.K., Weerts S.P. & Raimondo, D.C., 2019 (eds). South African National Biodiversity Assessment 2018 Technical Report Volume 3: Estuarine Realm. CSIR report. South African National Biodiversity Institute, Pretoria.
Van Niekerk, L. et al. 2013. Country-wide assessment of estuary health: An approach for integrating pressures and ecosystem response in a data limited environment. Estuarine, Coastal and Shelf Science 130: 239–251. https://doi.org/10.1016/j.ecss.2013.05.006
Recommended citation
Van Niekerk, L., Taljaard, S., Adams, J.B., Lamberth, S.J., Mackay, F.C., Weerts, S.P., Lemley, D.A., James, N.C., Rishworth, G.M., Turpie, J.K., Nhleko, J., & Lakane, C.P. 2026. Ecological condition: Estuarine realm. National Biodiversity Assessment 2025. South African National Biodiversity Institute. http://nba.sanbi.org.za/.
References
1. Lamberth, S.J. & J.K. Turpie. 2003. The role of estuaries in south african fisheries: Economic importance and management implications. African Journal of Marine Science 25: 131–157. https://doi.org/10.2989/18142320309504005
2. Water Affairs, D. of & Forestry. 2008. Water resource protection and assessment policy implementation process. Resource directed measures for protection of water resource: Methodology for the determination of the ecological water requirements for estuaries. Pretoria, South Africa.
3. Turpie, J. 2013. The estuary health index: A standardised metric for use in estuary management and the determination of ecological water requirements: Report to the water research commission. Water Research Commission.
4. Adams, J.B.B. et al. 2002. A method to assess the freshwater inflow requirements of estuaries and application to the mtata estuary , south africa. Estuaries 25: 1382–1393. https://doi.org/10.1007/bf02692232
5. Van Niekerk, L. et al. 2013. Country-wide assessment of estuary health: An approach for integrating pressures and ecosystem response in a data limited environment. Estuarine, Coastal and Shelf Science 130: 239–251. https://doi.org/10.1016/j.ecss.2013.05.006
6. Van Niekerk, L. et al. 2019. Assessing and planning future estuarine resource use: A scenario-based regional-scale freshwater allocation approach. Science of The Total Environment 657: 1000–1013. https://doi.org/10.1016/j.scitotenv.2018.12.033