South Africa is one of few countries that started assessing ecosystem threat status (circa 2004), using national criteria, before the IUCN Red List of Ecosystems (RLE) was developed1. For the National Biodiversity Assessment 2018 efforts were made to transition to the IUCN RLE framework for terrestrial ecosystem assessments2 and partially for estuaries and marine ecosystems, with some deviations in the thresholds that were applied. For the NBA 2025, there was full application of the IUCN RLE criteria for the first time in South Africa across all realms following the latest guidelines3 to ensure best practice and global alignment.
The IUCN Red List of Ecosystems Framework
The IUCN RLE is a global framework for assessing the risks to ecosystems and identifying where ecosystems are threatened4,5. Based on a set of criteria and thresholds developed collaboratively since 2008, the IUCN RLE was established to ensure that the assessment methods:
can be applied systematically across realms and geographic areas;
are transparent and scientifically rigorous;
are comparable and repeatable;
can be easily understood by policy makers and the general public; and
complement the IUCN Red List of Threatened Species (RLS) framework
The goal of this global framework is to identify ecosystems that are at risk of losing their constituent biodiversity. The unit of assessment in the RLE is an ecosystem type. The RLE framework used the concept of ecosystem collapse as the “end point” of ecosystem decline. This is equivalent to species extinction in the RLS.
Key elements of the IUCN RLE framework
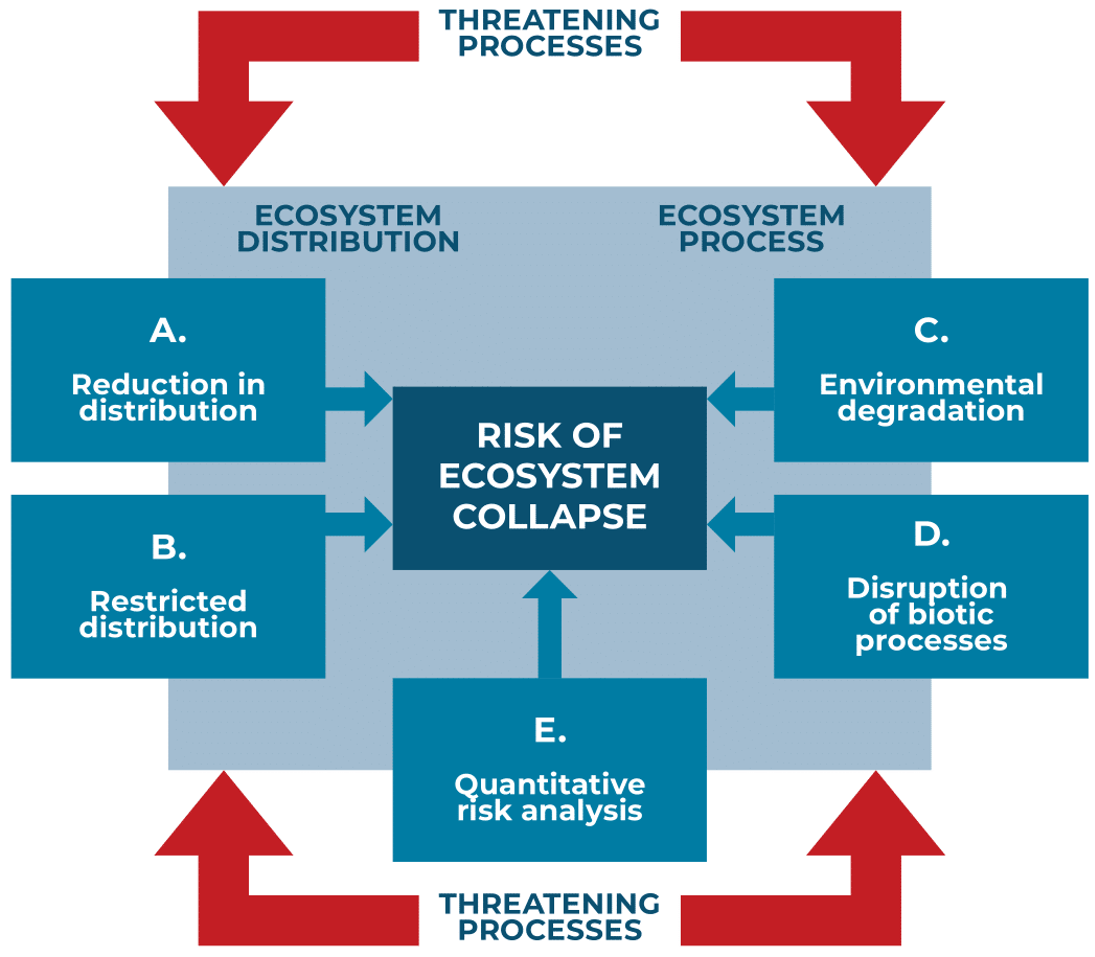
As outlined above, the IUCN Red List of Ecosystems (RLE) framework comprises three key components which provide a transparent and structured approach for assessing the risk of ecosystem collapse across diverse realms and different regions (Figure 1). These include:
a set of spatial and functional criteria that describe the different ways in which ecosystems may become threatened;
a set of qualitative and quantitative thresholds linked to ecosystem extent, ecological condition, and threatening processes, which indicate how close ecosystems are to collapse based on the severity of threats, degradation in condition, and the proportion of ecosystem extent lost; and
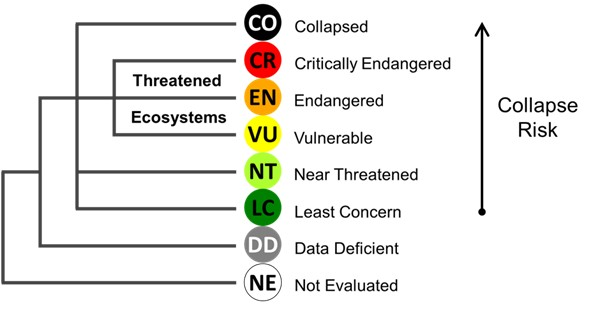
a set of ordinal categories that rank ecosystems according to their relative risk of collapse.
The adoption of the IUCN RLE standards by more than 100 countries underscores its growing global relevance and has greatly advanced efforts toward establishing a comprehensive inventory of the world’s threatened ecosystems. Beyond ecosystem red-listing, the framework also supports ecosystem monitoring, prioritisation of conservation actions, and the identification of restoration opportunities, making it a cornerstone of global biodiversity conservation planning6.
Application of the IUCN RLE criteria and categories
Data availability to assess all the criteria differs per realm. Therefore, the following criteria were assessed in each case (Table 1). Broadly speaking, each realm assessment evaluated ecosystem types that are at risk of collapse because of habitat loss (A), because they are small in extent and declining in ecological condition (B), or because of declining ecological condition in their abiotic and/or biotic components (C, D). Criterion E is currently assessed as Data Deficient (DD) in all realms.
| A2b | A3 | B1 | B2 | B3 | C3 | D1 | D3 | ||
|---|---|---|---|---|---|---|---|---|---|
| Terrestrial | ✓ | ✓ | ✓ | ✓ | ✓ | ✓ | |||
| Rivers | ✓ | ✓ | ✓ | ||||||
| Realms | Inland wetlands | ✓ | ✓ | ✓ | ✓ | ✓ | |||
| Estuaries | ✓ | ✓ | ✓ | ✓ | ✓ | ||||
| Marine | ✓ | ✓ | ✓ | ✓ | ✓ |
Red List Index of ecosystems
The Red List Index of Ecosystems (RLIe) is one of the new headline indicators formally recognised in December 2022 as part of the expanded suite of ecosystem monitoring tools under the post-2020 Kunming–Montreal Global Biodiversity Framework (GBF). This indicator provides a systematic mechanism for tracking progress towards achieving Goal A of the GBF, which focuses on maintaining and enhancing ecosystem integrity.
Conceptually, the RLIe mirrors and complements the Red List Index8 (of species), offering comparable insights into ecosystem-level risk. It tracks changes in the threat status of ecosystems over time9,10, with all trend assessments derived directly from the outcomes of IUCN RLE assessments. This indicator reflects genuine changes in ecosystem status, accounting for improvements in data and understanding across assessment periods. Broadly speaking, the RLIe represents the mean of ordinal ranks assigned to each risk category and is defined as follows:
\[ RLIE_t = 1 - \frac{\sum_{i = 1}^{n} W_{C_{i,t}}}{W_{C_O} \cdot n} \]
Where:
\(W_{C_{i,t}}\) represents the risk category rank for ecosystem \(i\) in year \(t\).
\(W_{C_O}\) is the maximum category rank (Collapsed = 5).
\(n\) is the total number of ecosystems, excluding Data-Deficient and/or Not Evaluated ecosystems.
Risk category ranks:
Collapsed = 5
Critically Endangered = 4
Endangered = 3
Vulnerable = 2
Near Threatened = 1
Least Concern = 0
RLIe scores range from 0 (all ecosystems collapsed) to 1 (all ecosystems classified as Least Concern), providing a clear and comparable measure of ecosystem health across time and space. The indicator is designed for flexible application, allowing trends to be assessed for overall risk categories, or by individual criteria to reveal key drivers of ecosystem change. In addition, the RLIe can be disaggregated by South African biome for national reporting, or ecosystem functional group, aligning with the IUCN Global Ecosystem Typology10,11 for global reporting.