
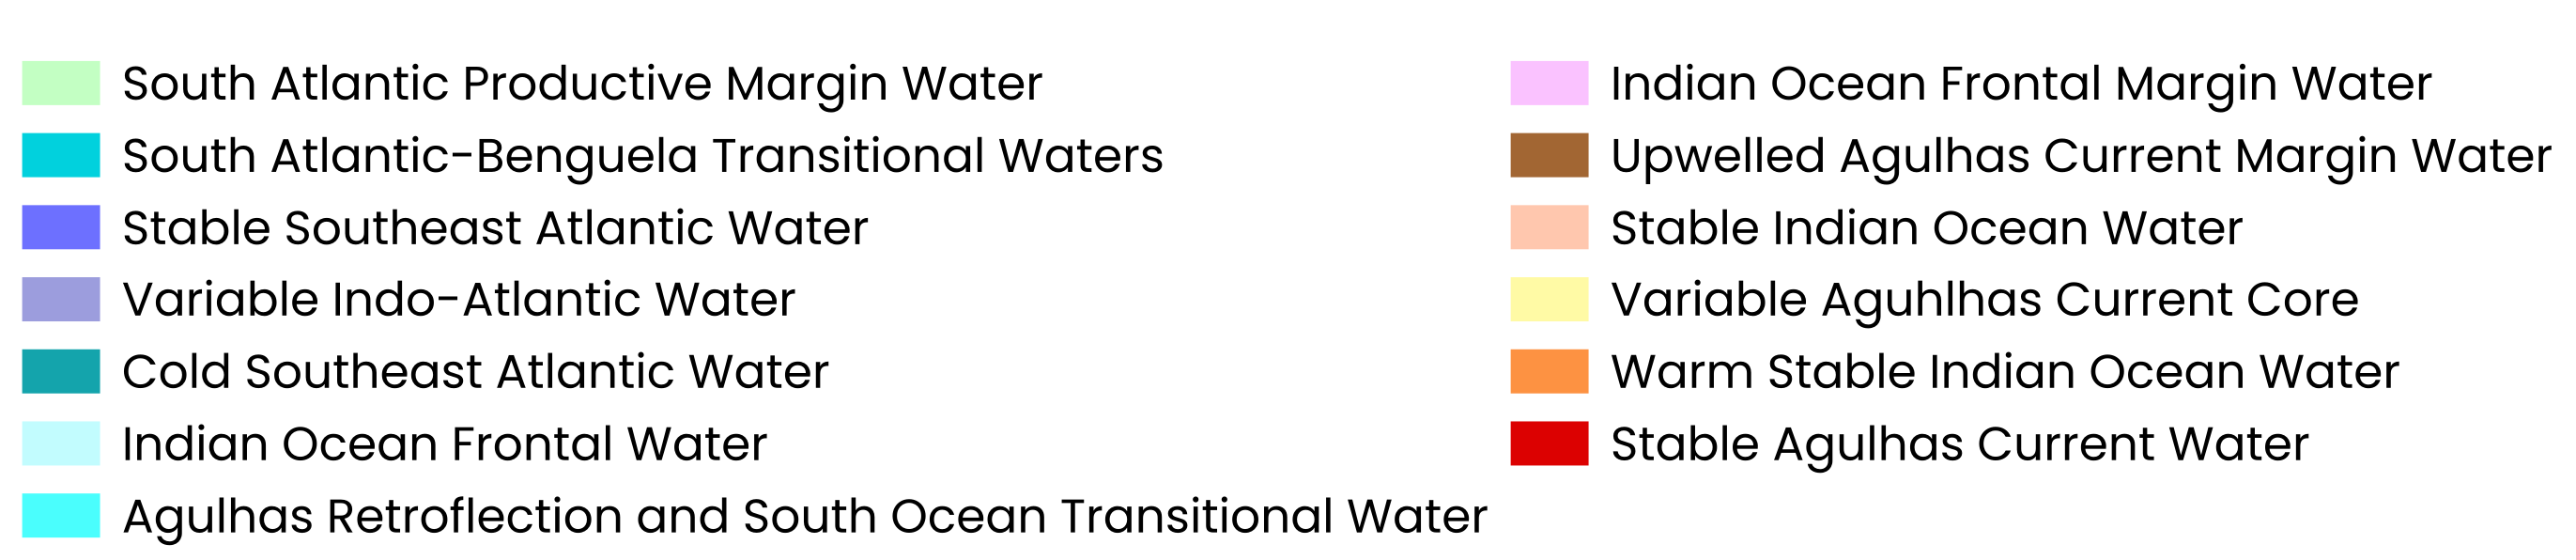
South Africa’s marine environment includes the Atlantic, Indian and Southern Oceans. The contrasting cold Benguela upwelling region and the warm, fast flowing Agulhas current interact with a diverse topography and geological setting to drive exceptional marine biodiversity and high endemism. South Africa is iteratively improving the map of marine ecosystem types as our knowledge of the ocean grows. The latest 2023 Marine Ecosystem Map contains 163 ecosystem types that nest within 17 ecosystem functional groups, in alignment with the IUCN Global Ecosystem Typology (GET). Progress is underway to leverage rapidly expanding marine data for improved ecosystem mapping. Further investment in data science capacity will be critical to integrate expanding knowledge into robust ecosystem classifications, assessments and plans.
Marine ecosystem types
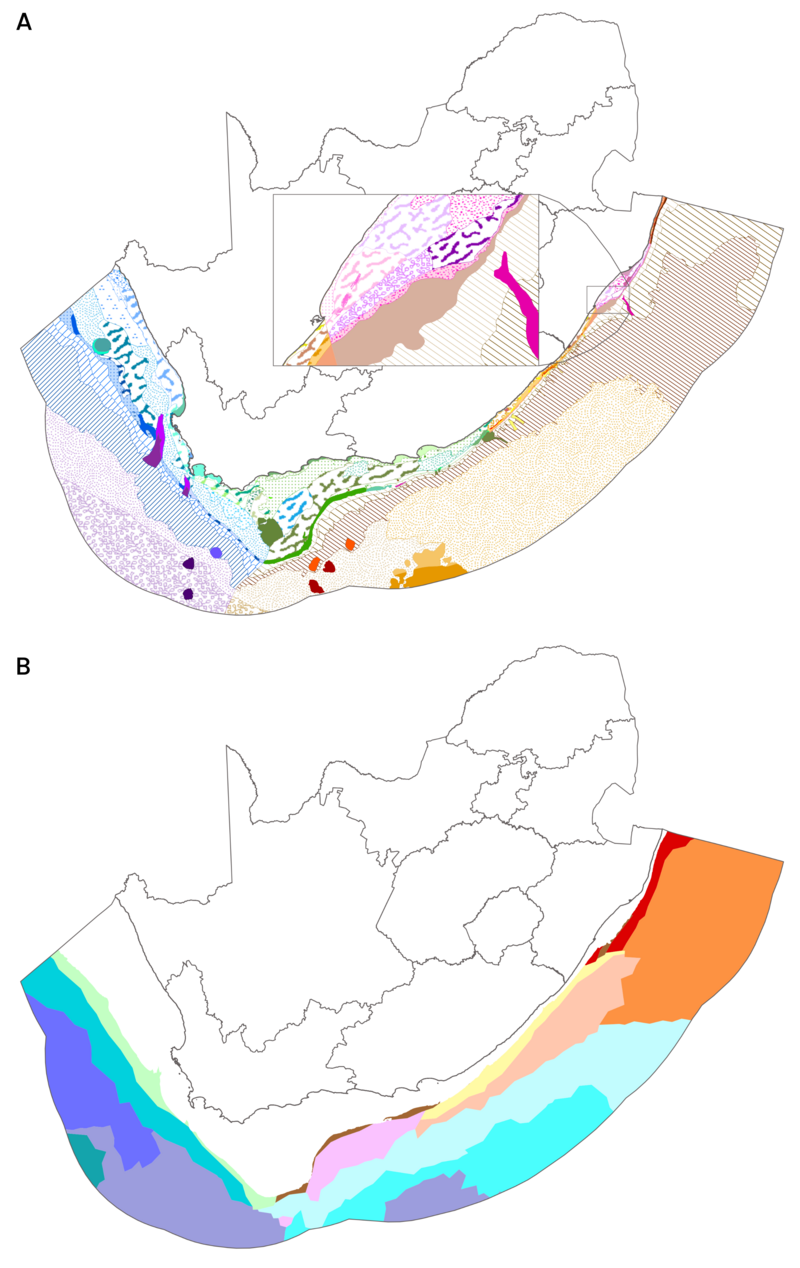
The 2025 National Biodiversity Assessment used the 2023 Marine Ecosystem Map (Figure 1) to assess the state of 163 marine ecosystem types around mainland South Africa. See the subantarctic territory page for an overview of the marine ecosystem types in the Prince Edward Islands. South Africa’s mainland maritime domain (territorial seas plus Exclusive Economic Zone) extends from the dune base to 200 NM seaward, representing an area of approximately 1.07 million km2 and extending to a depth of about 5 500 m. The continental shelf width varies between ~2 and 260 km, and the shelf break depth ranges between 80 and 600 m, being terraced in places (de Wet and Compton, 2021). The Agulhas Bank is a 116 000 km2 triangular extension of the continental shelf that supports many endemic species. Shelf areas constitute approximately 40% of the mainland maritime domain with slope and abyssal ecosystems constituting the remaining 60%. South Africa has a coastline length of over 3 000 km. A separate coastal chapter covers the ecologically determined coastal zone.
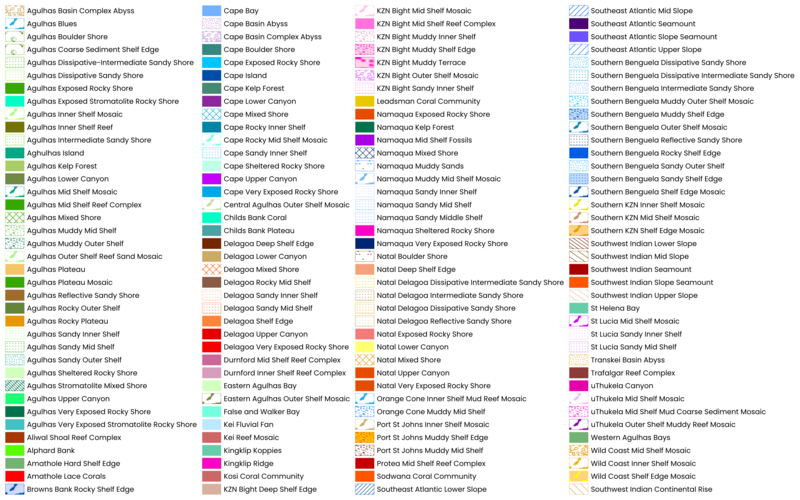
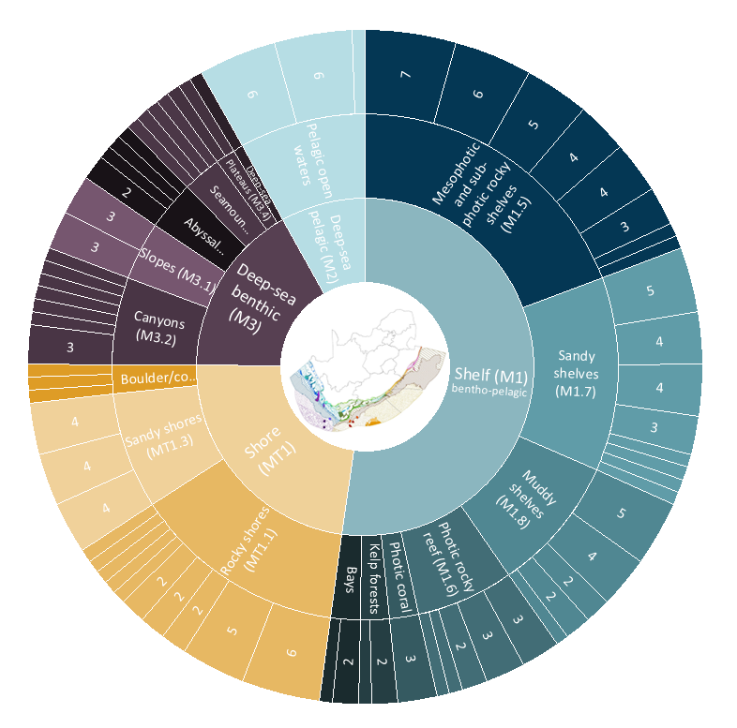
The 2023 Marine Ecosystem Map includes 128 shore and shelf ecosystem types which are considered benthopelagic, with 22 deepsea benthic and 13 deepsea pelagic ecosystem types (Figure 2). These 163 ecosystem types nest within 17 ecosystem functional groups (Figure 2) that align with those of the IUCN GET, except for minor differences in terminology, and South Africa included Bays as a distinct group. The ecosystem functional groups are nested within bathomes, which represent geomorphological depth categories equivalent to ‘biomes’ in the IUCN GET.
Approach
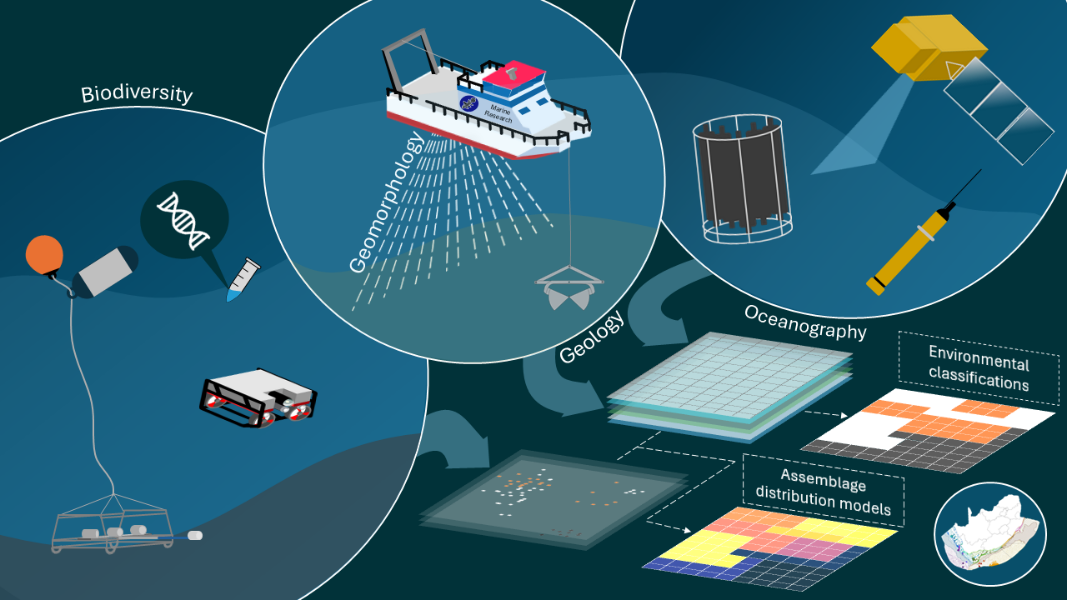
Since 2004, South Africa has followed an approach that iteratively improves the classification and mapping of marine ecosystem types1. The Marine Ecosystem Map is informed by a broad range of data (Figure 3) derived from many types of surveys, including bathymetric, geological, oceanographic and biodiversity research. It is a large collaborative effort and the 2023 Marine Ecosystem Map was developed with contributions from 29 authors from 18 different institutions. The map classification follows a nested hierarchy and the 2023 version sought to align with the IUCN GET structure.
Updating the Marine Ecosystem Map
Like its predecessors, the 2023 Marine Ecosystem Map relied heavily on thematic approaches and expert-informed decision-making. Technological advancements are continuously improving our ability to monitor and survey ocean spaces, rapidly increasing the data available to characterise, delineate and understand marine ecosystems. Work is ongoing to update and improve the next version of the Marine Ecosystem Map, which will inform the following National Biodiversity Assessment.
SANBI is implementing data and analytical frameworks to leverage the rapidly escalating volumes of ocean data to improve the Marine Ecosystem Map. This framework consists of a collection of scripted and documented workflows hosted in online project repositories. The scripted workflow components can be updated as new data or better methods become available, can be maintained despite turnover in staff and guiding experts, and are making inroads towards more transparent and reproducible science. This data-driven and reproducible approach has included collation of a suite of environmental gridded data layers and biodiversity survey datasets.
In regions where sufficient biodiversity data occur, the environmental layers and occurrence records are combined in statistical assemblage distribution models that estimate the co-occurring species assemblages and their preferred habitats, thereby predicting biodiversity patterns and characterising their composition. In regions where insufficient biodiversity data have been collected for the biodiversity analyses, gridded environmental layers are combined in environmental classifications (cluster analyses) to delineate unique habitats (Figure 3). The outputs from the assemblage distribution models and the environmental clusters are used as evidence, together with published biogeographic patterns, to consider updates to the ecosystem map. Updates to ecosystem components or types, such as newly mapped submarine canyons and kelp forests mapped from satellite data2 are being incorporated in the ecosystem map.
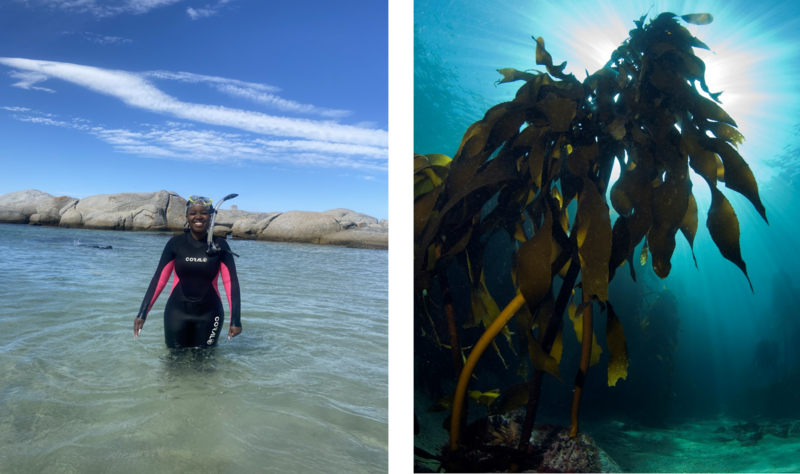
NoteBox 1. The Great African Sea Forest: Kelp forest ecosystem types in South Africa
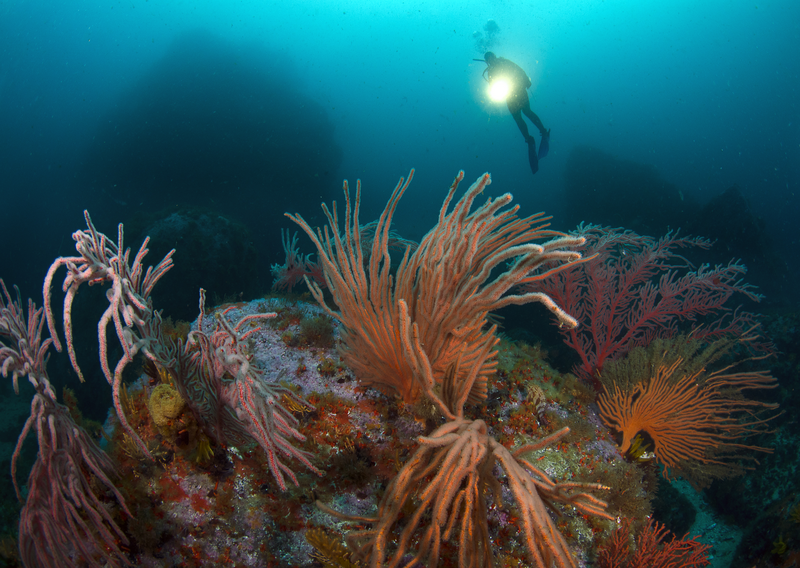
Large brown seaweeds of the order Laminariales fringe rocky shores of temperate and high-latitude regions, creating kelp forest ecosystem types that cover over 30% of shallow rocky reefs globally. They are among the most productive ecosystems on earth and offer many social and economic benefits, including fishing, ecotourism, a variety of kelp-derived products, and play a role in fixing atmospheric carbon3. Evidence of consumption of species associated with kelp forests has been dated to about 70 000 years ago in South Africa. The extent of kelp forests has been documented to change, with expansion reported locally4 and cases of kelp loss documented internationally5.
Dunga et al. (2024) created the first comprehensive high-resolution map of canopy forming coastal kelp in South Africa, covering the spatial distribution of Ecklonia maxima, Laminaria pallida and Macrocystis pyrifera2. This work highlighted the need for improved long-term monitoring to understand distributional changes and better mapping of subsurface kelp, particularly Ecklonia radiata, which has been recorded in deeper waters from trawl and remotely operated vehicle surveys on the eastern shelf of South Africa6,7. The kelp map enabled the classification and delineation of three kelp forest ecosystem types in South Africa, the Namaqua, Cape, and Agulhas kelp forests and supported their ecosystem threat status assessment using the IUCN Red List of Ecosystems criteria8.
The updated environmental layers have been organised by thematic groups, which include oceanography, geology and geomorphology. A suite of oceanographic (physical, chemical and phytoplankton) variables for surface and seafloor depths were downloaded from the Bio-ORACLE platform and calculated from Copernicus Marine Service satellite products and regional ocean model hindcasts provided by SAEON and SOMISANA. Updated sediment data were sourced from collaborators, greatly increasing the inventory of marine sediment sample and seafloor description records. Interpolated maps of sediment characteristics were additionally sourced from dbSEABED. Geomorphological variables included a new, national-scale, 100-m resolution bathymetry map9, from which derived variables such as slope angle, bathymetric position index and rugosity were calculated.
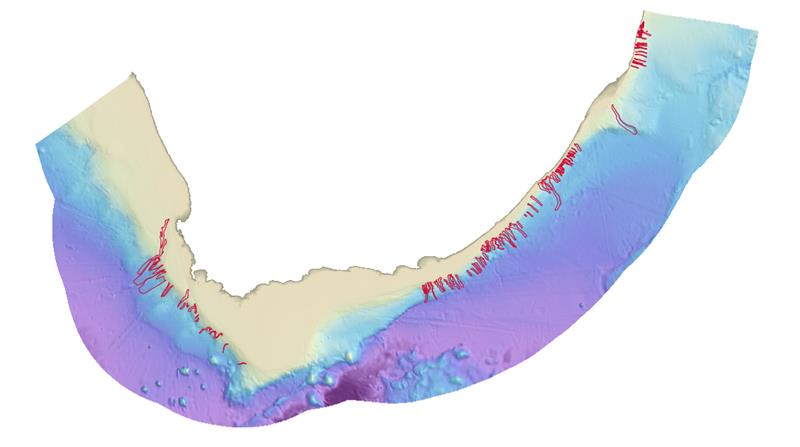
NoteBox 2. South Africa’s submarine canyons
Submarine canyons are steep-sided valleys that cut into the continental slope and play an important role in connecting coastal and deep-sea environments by facilitating the vertical movement of water, sediments, and nutrients. Many of these canyons host complex terrain, diverse substrate types, habitats and species, including vulnerable marine ecosystem indicators, such as cold-water corals and sponges. They act as important nursery and feeding grounds for a variety of benthic and pelagic species, some of which are conservation priorities, such as the African coelacanth (Latimeria chalumnae). Furthermore, submarine canyons can act as refuges from anthropogenic pressures, such as trawling, in areas where steep slopes and complex terrain limit human access.
Despite their ecological importance, many of South Africa’s submarine canyons have remained unknown and unmapped due to limited coverage of high-resolution bathymetry data. The release of the 100-m resolution national-scale bathymetric map in 2024, combined with additional unpublished multibeam echosounder datasets, has enabled a substantial advance in the mapping of submarine canyon features in South Africa, increasing the number of canyon polygons from 39 in 2018 to 120. This work, led by Nokubonga Mzimela, enhances knowledge on canyon classification and geomorphological processes, identifies shelf-breaching canyons that influence shelf ecology, supports habitat predictions for coelacanths and other species, and will improve the delineation of canyon ecosystem types in the next Marine Ecosystem Map.
Significant strides were also made in the collation of marine biodiversity records in a biodiversity occurrence database. Data were sourced from online data repositories, such as OBIS and GBIF and requested from a network of collaborators at a variety of government and tertiary research institutions. In October 2025, the database contained 1 310 081 records from 7 726 marine species and 12 data sources, representing a growing collection of biodiversity data in waters around South Africa. Although only a selection of marine survey datasets have been used in assemblage distribution models, the vision is to build a comprehensive biodiversity database that will enable presence-only modelling of biodiversity patterns and species turnover across broad taxonomic groups sourced from many datasets.
The adoption of reproducible data and analytical pipelines marks a shift in ecosystem mapping methods, one that should improve efficiency, transparency and foster greater understanding and confidence in the resulting ecosystem map, which informs biodiversity management, spatial planning, and conservation efforts in South Africa. Further investment in data science will be needed to curate and integrate rapidly expanding data streams if South Africa is to maintain a robust evidence base to underpin improved ecosystem classification, mapping, assessment, planning, mainstreaming and decision-making.
Acknowledgements
The development of national maps of ecosystem types is part of the mandate of the South African National Biodiversity Institute. We acknowledge all participants in South Africa’s three previous national biodiversity assessments (2004, 2011, 2018) and the broader communities of practice that support spatial biodiversity assessment and planning in South Africa.
The organizations, departments and funders of all contributors to Sink et al. 2023 are acknowledged for their support. The National Marine Ecosystem Committee and Network, the Marine Emerging Researchers Task team, the National Ecosystem Classification Committees and the National Marine Biodiversity Scientific Working Group are thanked for their invaluable technical expertise and guidance. We acknowledge Megan van der Bank for her work in co-ordination and support of the marine ecosystem network and Prideel Majiedt for her technical support and policy insights.
During this assessment period, ecosystem classification and mapping work was supported through funding received from the European Union’s Horizon 2020 research and innovation program under Grant Agreement No. 862428 (MISSION ATLANTIC). The ACEP Deep Connections, Agulhas Bank Connections and Deep Forests projects funded through the National Research Foundation (NRF Grants 129216, 129213, and 110765) are acknowledged. The FBIP funded SeaMap project (funded through the NRF Grant number 138572) is acknowledged for its contributions in advancing knowledge which informed the update of the national marine ecosystem map.
Technical documentation
Code repositories
Data
Key publications
Currie, J.C. et al. 2024. Plan for the 2025 Marine Ecosystem Map. South African National Biodiversity Institute, Cape Town.
Dayaram, A. et al. 2021. The South African National Ecosystem Classification System Handbook, First Edition. South African National Biodiversity Institute, Pretoria.
Sink, K.J. et al. 2023. Iterative mapping of marine ecosystems for spatial status assessment, prioritization, and decision support. Frontiers in Ecology and Evolution 11: https://doi.org/10.3389/fevo.2023.1108118
Recommended citation
Sink, K.J., Currie, J.C., Besseling, N.A., Adams, L.A., Mzimela, N.Z., Dunga, L.V., Hambile, N., & Dayaram, A. 2026. Ecosystem types: Marine realm. National Biodiversity Assessment 2025. South African National Biodiversity Institute. http://nba.sanbi.org.za/.
References
1. Sink, K.J. et al. 2023. Identifying biodiversity priority areas to support offshore marine protected area expansion in South Africa. Stakeholder workshops report for the iAtlantic South African Systematic Conservation Planning Case Study, November 2022-August 2023.
2. Dunga, L. et al. 2024. Mapping South Africa’s canopy-forming kelp forests using low-cost, high-resolution sentinel-2 imagery. Estuarine, Coastal and Shelf Science 310: 108989.
3. Blamey, L.K. & J.J. Bolton. 2018. The economic value of South African kelp forests and temperate reefs: Past, present and future. Journal of Marine Systems. Special Issue. Benguela: Opportunity, Challenge and Change 188: 172–181. https://doi.org/10.1016/j.jmarsys.2017.06.003
4. Bolton, J. et al. 2012. South African kelp moving eastwards: The discovery of Ecklonia maxima (Osbeck) Papenfuss at De Hoop nature reserve on the south coast of South Africa. African Journal of Marine Science 34: 147–151. https://doi.org/10.2989/1814232X.2012.675125
5. Coleman, M.A. et al. 2022. Loss of a globally unique kelp forest from Oman. Scientific Reports 12: 5020.
6. Qwabe, W. et al. 2023. First mesophotic Ecklonia radiata (Laminariales) records within the iSimangaliso Wetland Park marine-protected area, east coast, South Africa. Journal of the Marine Biological Association of the United Kingdom 103: e91. https://doi.org/10.1017/S0025315423000784
7. Sink, K. & F. MacKay. 2018. Nansen survey voyage 2018401 leg 1 South Africa: Field notes relevant to ecosystem classification, mapping and description, unpublished report. South Africa.
8. Dunga, V.L. 2020. Mapping and assessing ecosystem threat status of South African kelp forests.
9. Manikam, S.L. et al. 2024. Bathymetric grid of South Africa’s mainland maritime domain. https://doi.org/10.15493/SANBI.220424
10. Adams, L. et al. 2024. Advancing the southern african marine biodiversity reference image collection. Cape Town, South Africa.