
While numerous policies and strategies aim to improve or at least stabilise the ecological condition of wetlands in South Africa, overall wetland condition continues to deteriorate. Continued wetland loss and declining ecological condition has led to significant ecological and financial loss. This deterioration is often gradual and ‘out of sight’ and, therefore, generally not perceived as an immediate problem. It is, however, a serious concern which should be addressed through restoration (where feasible and strategic) and improved, frequent monitoring and reporting.
49%
of wetland extent
Natural or Near-natural
of wetland extent
Natural or Near-natural
58%
of 171 303 inland wetlands
Natural or Near-natural
of 171 303 inland wetlands
Natural or Near-natural
| Natural | Near-natural | Moderately modified | Heavily modified | Severely modified | Critically modified | ||
|---|---|---|---|---|---|---|---|
| Albany Thicket_Depression | Extent (km2) | 4 | 13 | 1 | 1 | 1 | 5 |
| Percentage | 17 | 52 | 4 | 5 | 2 | 20 | |
| Albany Thicket_Floodplain | Extent (km2) | 1 | 11 | 6 | 1 | 10 | 0 |
| Percentage | 2 | 39 | 22 | 2 | 35 | 0 | |
| Albany Thicket_Seep | Extent (km2) | 2 | 1 | 1 | 1 | 1 | 0 |
| Percentage | 33 | 21 | 21 | 12 | 14 | 0 | |
| Albany Thicket_Unchannelled valley-bottom | Extent (km2) | 1 | 1 | 0 | 0 | 2 | 0 |
| Percentage | 23 | 12 | 5 | 7 | 53 | 0 | |
| Bushmanland_Depression | Extent (km2) | 376 | 2 655 | 200 | 17 | 15 | 8 |
| Percentage | 11 | 81 | 6 | 1 | 0 | 0 | |
| Bushmanland_Floodplain | Extent (km2) | 93 | 1 | 0 | 0 | 0 | 0 |
| Percentage | 99 | 1 | 0 | 0 | 0 | 0 | |
| Bushmanland_Seep | Extent (km2) | 16 | 1 | 0 | 0 | 0 | 0 |
| Percentage | 96 | 4 | 0 | 0 | 0 | 0 | |
| Bushmanland_Unchannelled valley-bottom | Extent (km2) | 690 | 17 | 0 | 0 | 0 | 0 |
| Percentage | 98 | 2 | 0 | 0 | 0 | 0 | |
| Central Bushveld_Depression | Extent (km2) | 3 | 38 | 8 | 2 | 1 | 2 |
| Percentage | 5 | 71 | 14 | 4 | 2 | 3 | |
| Central Bushveld_Floodplain | Extent (km2) | 167 | 194 | 821 | 244 | 151 | 2 |
| Percentage | 11 | 12 | 52 | 15 | 10 | 0 | |
| Central Bushveld_Seep | Extent (km2) | 43 | 21 | 52 | 43 | 36 | 3 |
| Percentage | 22 | 11 | 26 | 22 | 18 | 2 | |
| Central Bushveld_Unchannelled valley-bottom | Extent (km2) | 52 | 212 | 86 | 48 | 46 | 1 |
| Percentage | 12 | 48 | 19 | 11 | 10 | 0 | |
| Drakensberg Grassland_Depression | Extent (km2) | 6 | 4 | 0 | 0 | 0 | 0 |
| Percentage | 56 | 39 | 1 | 2 | 0 | 1 | |
| Drakensberg Grassland_Floodplain | Extent (km2) | 24 | 22 | 86 | 93 | 14 | 0 |
| Percentage | 10 | 9 | 36 | 39 | 6 | 0 | |
| Drakensberg Grassland_Seep | Extent (km2) | 58 | 13 | 25 | 27 | 12 | 3 |
| Percentage | 42 | 9 | 18 | 20 | 9 | 2 | |
| Drakensberg Grassland_Unchannelled valley-bottom | Extent (km2) | 9 | 0 | 1 | 1 | 7 | 0 |
| Percentage | 50 | 1 | 7 | 3 | 38 | 2 | |
| Dry Highveld Grassland_Depression | Extent (km2) | 426 | 457 | 181 | 61 | 28 | 39 |
| Percentage | 36 | 38 | 15 | 5 | 2 | 3 | |
| Dry Highveld Grassland_Floodplain | Extent (km2) | 92 | 544 | 681 | 128 | 39 | 1 |
| Percentage | 6 | 37 | 46 | 9 | 3 | 0 | |
| Dry Highveld Grassland_Seep | Extent (km2) | 29 | 42 | 128 | 17 | 26 | 2 |
| Percentage | 12 | 17 | 53 | 7 | 11 | 1 | |
| Dry Highveld Grassland_Unchannelled valley-bottom | Extent (km2) | 46 | 314 | 375 | 68 | 33 | 0 |
| Percentage | 5 | 38 | 45 | 8 | 4 | 0 | |
| East Coast Renosterveld_Depression | Extent (km2) | 16 | 1 | 1 | 1 | 0 | 0 |
| Percentage | 81 | 5 | 7 | 5 | 2 | 2 | |
| East Coast Renosterveld_Floodplain | Extent (km2) | 4 | 12 | 142 | 101 | 90 | 0 |
| Percentage | 1 | 3 | 40 | 29 | 26 | 0 | |
| East Coast Renosterveld_Seep | Extent (km2) | 6 | 15 | 22 | 21 | 16 | 2 |
| Percentage | 7 | 19 | 26 | 26 | 20 | 3 | |
| East Coast Renosterveld_Unchannelled valley-bottom | Extent (km2) | 0 | 7 | 0 | 4 | 0 | 0 |
| Percentage | 0 | 64 | 1 | 34 | 1 | 0 | |
| Eastern Fynbos-Renosterveld_Depression | Extent (km2) | 0 | 3 | 0 | 0 | 1 | 0 |
| Percentage | 2 | 64 | 9 | 4 | 13 | 7 | |
| Eastern Kalahari Bushveld_Depression | Extent (km2) | 125 | 809 | 69 | 17 | 11 | 10 |
| Percentage | 12 | 78 | 7 | 2 | 1 | 1 | |
| Eastern Kalahari Bushveld_Seep | Extent (km2) | 189 | 22 | 46 | 10 | 17 | 0 |
| Percentage | 67 | 8 | 16 | 3 | 6 | 0 | |
| Eastern Kalahari Bushveld_Unchannelled valley-bottom | Extent (km2) | 153 | 167 | 45 | 12 | 6 | 0 |
| Percentage | 40 | 44 | 12 | 3 | 2 | 0 | |
| Kalahari Duneveld_Depression | Extent (km2) | 80 | 162 | 37 | 22 | 38 | 3 |
| Percentage | 23 | 47 | 11 | 6 | 11 | 1 | |
| Kalahari Duneveld_Seep | Extent (km2) | 8 | 0 | 0 | 0 | 0 | 0 |
| Percentage | 100 | 0 | 0 | 0 | 0 | 0 | |
| Karoo Interior_Depression | Extent (km2) | 154 | 479 | 18 | 13 | 4 | 1 |
| Percentage | 23 | 72 | 3 | 2 | 1 | 0 | |
| Karoo Interior_Floodplain | Extent (km2) | 595 | 184 | 143 | 257 | 114 | 0 |
| Percentage | 46 | 14 | 11 | 20 | 9 | 0 | |
| Karoo Interior_Seep | Extent (km2) | 76 | 5 | 3 | 2 | 2 | 0 |
| Percentage | 87 | 6 | 4 | 2 | 2 | 0 | |
| Karoo Interior_Unchannelled valley-bottom | Extent (km2) | 107 | 98 | 7 | 1 | 1 | 0 |
| Percentage | 50 | 46 | 3 | 0 | 0 | 0 | |
| Knersvlakte_Depression | Extent (km2) | 0 | 1 | 0 | 0 | 0 | 0 |
| Percentage | 1 | 87 | 0 | 0 | 12 | 0 | |
| Kwa-Zulu Natal Coastal Belt_Floodplain | Extent (km2) | 0 | 3 | 16 | 17 | 13 | 16 |
| Percentage | 0 | 4 | 25 | 27 | 20 | 24 | |
| Kwa-Zulu Natal Coastal Belt_Seep | Extent (km2) | 0 | 1 | 3 | 2 | 14 | 27 |
| Percentage | 1 | 2 | 6 | 4 | 30 | 58 | |
| Kwa-Zulu Natal Coastal Belt_Unchannelled valley-bottom | Extent (km2) | 0 | 2 | 4 | 2 | 9 | 10 |
| Percentage | 0 | 7 | 14 | 9 | 33 | 37 | |
| Lowveld_Depression | Extent (km2) | 4 | 59 | 14 | 3 | 8 | 3 |
| Percentage | 4 | 65 | 15 | 4 | 9 | 3 | |
| Lowveld_Floodplain | Extent (km2) | 187 | 82 | 160 | 127 | 59 | 9 |
| Percentage | 30 | 13 | 26 | 20 | 9 | 1 | |
| Lowveld_Seep | Extent (km2) | 49 | 26 | 56 | 53 | 46 | 8 |
| Percentage | 21 | 11 | 23 | 22 | 19 | 3 | |
| Lowveld_Unchannelled valley-bottom | Extent (km2) | 17 | 8 | 8 | 19 | 12 | 3 |
| Percentage | 25 | 12 | 12 | 28 | 17 | 5 | |
| Maputaland Coastal Belt_Depression | Extent (km2) | 3 | 90 | 107 | 11 | 6 | 6 |
| Percentage | 1 | 40 | 48 | 5 | 2 | 3 | |
| Maputaland Coastal Belt_Floodplain | Extent (km2) | 13 | 319 | 43 | 22 | 136 | 28 |
| Percentage | 2 | 57 | 8 | 4 | 24 | 5 | |
| Maputaland Coastal Belt_Seep | Extent (km2) | 7 | 1 | 8 | 4 | 9 | 9 |
| Percentage | 19 | 2 | 21 | 11 | 24 | 23 | |
| Maputaland Coastal Belt_Unchannelled valley-bottom | Extent (km2) | 15 | 7 | 10 | 10 | 10 | 6 |
| Percentage | 25 | 12 | 17 | 17 | 18 | 11 | |
| Mesic Highveld Grassland_Depression | Extent (km2) | 184 | 171 | 73 | 28 | 9 | 9 |
| Percentage | 39 | 36 | 15 | 6 | 2 | 2 | |
| Mesic Highveld Grassland_Floodplain | Extent (km2) | 168 | 1 293 | 2 232 | 828 | 227 | 8 |
| Percentage | 4 | 27 | 47 | 17 | 5 | 0 | |
| Mesic Highveld Grassland_Seep | Extent (km2) | 277 | 275 | 553 | 296 | 205 | 19 |
| Percentage | 17 | 17 | 34 | 18 | 13 | 1 | |
| Mesic Highveld Grassland_Unchannelled valley-bottom | Extent (km2) | 26 | 41 | 219 | 87 | 44 | 3 |
| Percentage | 6 | 10 | 52 | 21 | 11 | 1 | |
| Mopane_Depression | Extent (km2) | 0 | 11 | 1 | 0 | 0 | 0 |
| Percentage | 0 | 87 | 10 | 1 | 1 | 0 | |
| Mopane_Floodplain | Extent (km2) | 238 | 7 | 37 | 20 | 2 | 1 |
| Percentage | 78 | 2 | 12 | 6 | 1 | 0 | |
| Mopane_Seep | Extent (km2) | 1 | 0 | 0 | 0 | 0 | 0 |
| Percentage | 86 | 0 | 14 | 0 | 0 | 0 | |
| Mopane_Unchannelled valley-bottom | Extent (km2) | 42 | 1 | 0 | 0 | 0 | 0 |
| Percentage | 97 | 3 | 0 | 0 | 0 | 0 | |
| Namaqualand_Depression | Extent (km2) | 2 | 77 | 21 | 4 | 2 | 17 |
| Percentage | 2 | 63 | 17 | 3 | 1 | 14 | |
| Northwest Fynbos_Depression | Extent (km2) | 1 | 10 | 0 | 1 | 0 | 0 |
| Percentage | 9 | 79 | 1 | 7 | 3 | 0 | |
| Northwest Fynbos_Floodplain | Extent (km2) | 10 | 6 | 94 | 26 | 8 | 4 |
| Percentage | 7 | 4 | 64 | 18 | 5 | 3 | |
| Northwest Fynbos_Seep | Extent (km2) | 10 | 2 | 10 | 6 | 7 | 0 |
| Percentage | 27 | 7 | 29 | 18 | 20 | 0 | |
| Northwest Fynbos_Unchannelled valley-bottom | Extent (km2) | 1 | 0 | 3 | 1 | 2 | 0 |
| Percentage | 11 | 3 | 43 | 17 | 26 | 0 | |
| Pondoland Coastal Belt_Floodplain | Extent (km2) | 1 | 1 | 1 | 1 | 0 | 0 |
| Percentage | 22 | 25 | 20 | 26 | 7 | 0 | |
| Pondoland Coastal Belt_Seep | Extent (km2) | 4 | 4 | 4 | 1 | 2 | 0 |
| Percentage | 25 | 26 | 24 | 8 | 14 | 3 | |
| Pondoland Coastal Belt_Unchannelled valley-bottom | Extent (km2) | 1 | 1 | 3 | 0 | 0 | 0 |
| Percentage | 23 | 17 | 58 | 1 | 2 | 0 | |
| Southern Fynbos_Depression | Extent (km2) | 1 | 14 | 0 | 0 | 0 | 0 |
| Percentage | 6 | 93 | 0 | 1 | 0 | 0 | |
| Southern Fynbos_Floodplain | Extent (km2) | 40 | 12 | 34 | 93 | 55 | 1 |
| Percentage | 17 | 5 | 14 | 39 | 23 | 0 | |
| Southern Fynbos_Seep | Extent (km2) | 40 | 8 | 24 | 13 | 19 | 6 |
| Percentage | 36 | 8 | 22 | 12 | 17 | 5 | |
| Southern Fynbos_Unchannelled valley-bottom | Extent (km2) | 6 | 2 | 6 | 5 | 5 | 1 |
| Percentage | 24 | 8 | 24 | 20 | 20 | 3 | |
| Southwest Fynbos_Depression | Extent (km2) | 3 | 4 | 0 | 0 | 0 | 0 |
| Percentage | 37 | 56 | 4 | 2 | 0 | 0 | |
| Southwest Fynbos_Floodplain | Extent (km2) | 33 | 36 | 146 | 94 | 32 | 14 |
| Percentage | 9 | 10 | 41 | 26 | 9 | 4 | |
| Southwest Fynbos_Seep | Extent (km2) | 95 | 13 | 35 | 22 | 32 | 3 |
| Percentage | 47 | 7 | 17 | 11 | 16 | 2 | |
| Southwest Fynbos_Unchannelled valley-bottom | Extent (km2) | 3 | 1 | 8 | 0 | 1 | 0 |
| Percentage | 22 | 10 | 56 | 3 | 9 | 1 | |
| Sub-Escarpment Grassland_Depression | Extent (km2) | 5 | 8 | 29 | 2 | 1 | 1 |
| Percentage | 11 | 17 | 62 | 5 | 3 | 2 | |
| Sub-escarpment Grassland_Floodplain | Extent (km2) | 39 | 54 | 383 | 565 | 177 | 8 |
| Percentage | 3 | 4 | 31 | 46 | 14 | 1 | |
| Sub-escarpment Grassland_Seep | Extent (km2) | 170 | 130 | 316 | 370 | 326 | 45 |
| Percentage | 13 | 10 | 23 | 27 | 24 | 3 | |
| Sub-escarpment Grassland_Unchannelled valley-bottom | Extent (km2) | 25 | 28 | 76 | 96 | 44 | 4 |
| Percentage | 9 | 10 | 28 | 35 | 16 | 1 | |
| Sub-escarpment Savanna_Depression | Extent (km2) | 0 | 2 | 1 | 0 | 0 | 1 |
| Percentage | 4 | 47 | 18 | 10 | 6 | 15 | |
| Sub-escarpment Savanna_Floodplain | Extent (km2) | 1 | 5 | 38 | 52 | 63 | 14 |
| Percentage | 1 | 3 | 22 | 30 | 36 | 8 | |
| Sub-escarpment Savanna_Seep | Extent (km2) | 13 | 16 | 25 | 29 | 73 | 36 |
| Percentage | 7 | 8 | 13 | 15 | 38 | 19 | |
| Sub-escarpment Savanna_Unchannelled valley-bottom | Extent (km2) | 1 | 0 | 4 | 5 | 7 | 2 |
| Percentage | 3 | 2 | 22 | 28 | 37 | 9 | |
| West Coast_Depression | Extent (km2) | 2 | 4 | 8 | 3 | 1 | 0 |
| Percentage | 12 | 24 | 42 | 14 | 6 | 1 | |
| West Coast_Floodplain | Extent (km2) | 0 | 15 | 68 | 91 | 24 | 0 |
| Percentage | 0 | 8 | 34 | 46 | 12 | 0 | |
| West Coast_Seep | Extent (km2) | 1 | 1 | 17 | 6 | 7 | 1 |
| Percentage | 4 | 3 | 50 | 20 | 21 | 3 | |
| West Coast_Unchannelled valley-bottom | Extent (km2) | 1 | 1 | 2 | 1 | 1 | 0 |
| Percentage | 10 | 9 | 29 | 25 | 23 | 4 | |
Download the data by wetland type here.
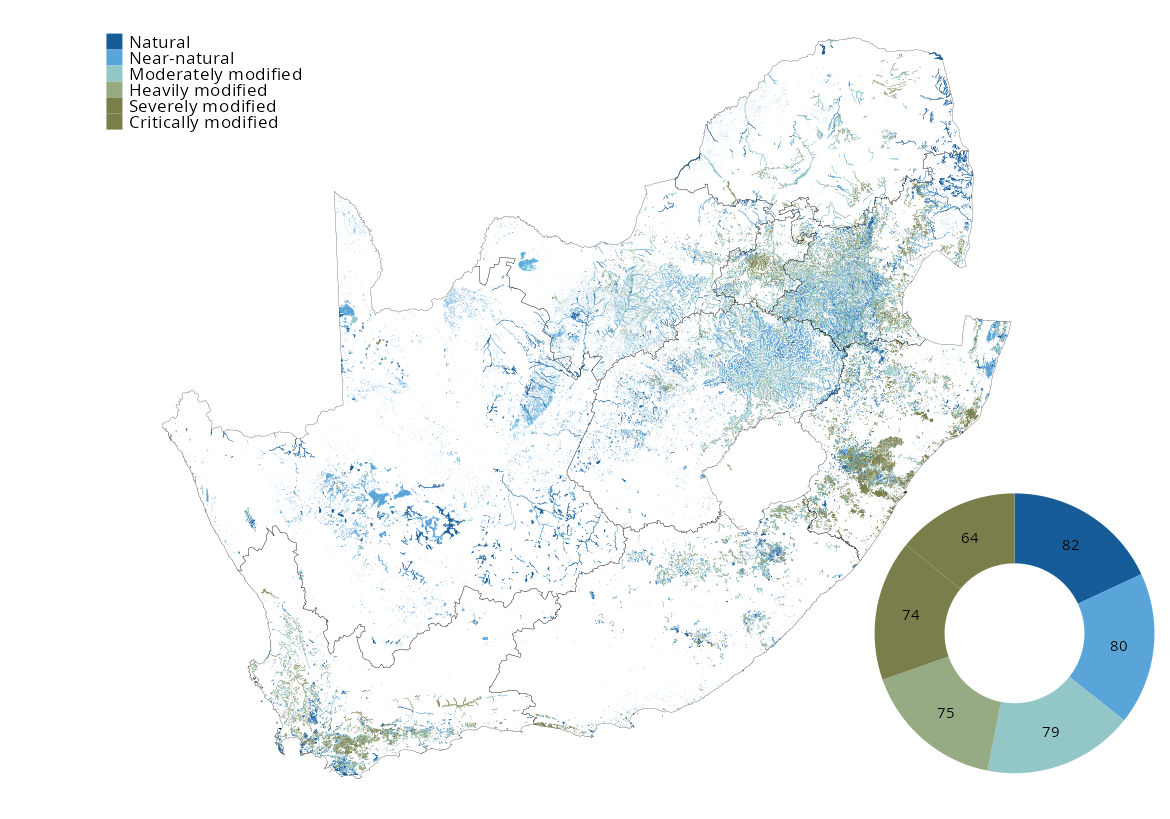
Approximately 1 476 561 ha (49%) of total inland wetland extent is in a natural (class A) or near-natural (class B) condition, 808 325 ha (27%) is in a moderately modified (class C) condition, and 705 797 ha (27%) is in a heavily to critically modified (class D, E or F) condition.
Ecological condition was calculated for 171 303 wetlands. Of these, approximately 100 029 wetlands (58%) are in a natural (class A) or near-natural (class B) condition, 24 752 (14%) are in a moderately modified (class C) condition and 46 522 (24%) are in a heavily to critically modified (class D, E or F) condition.
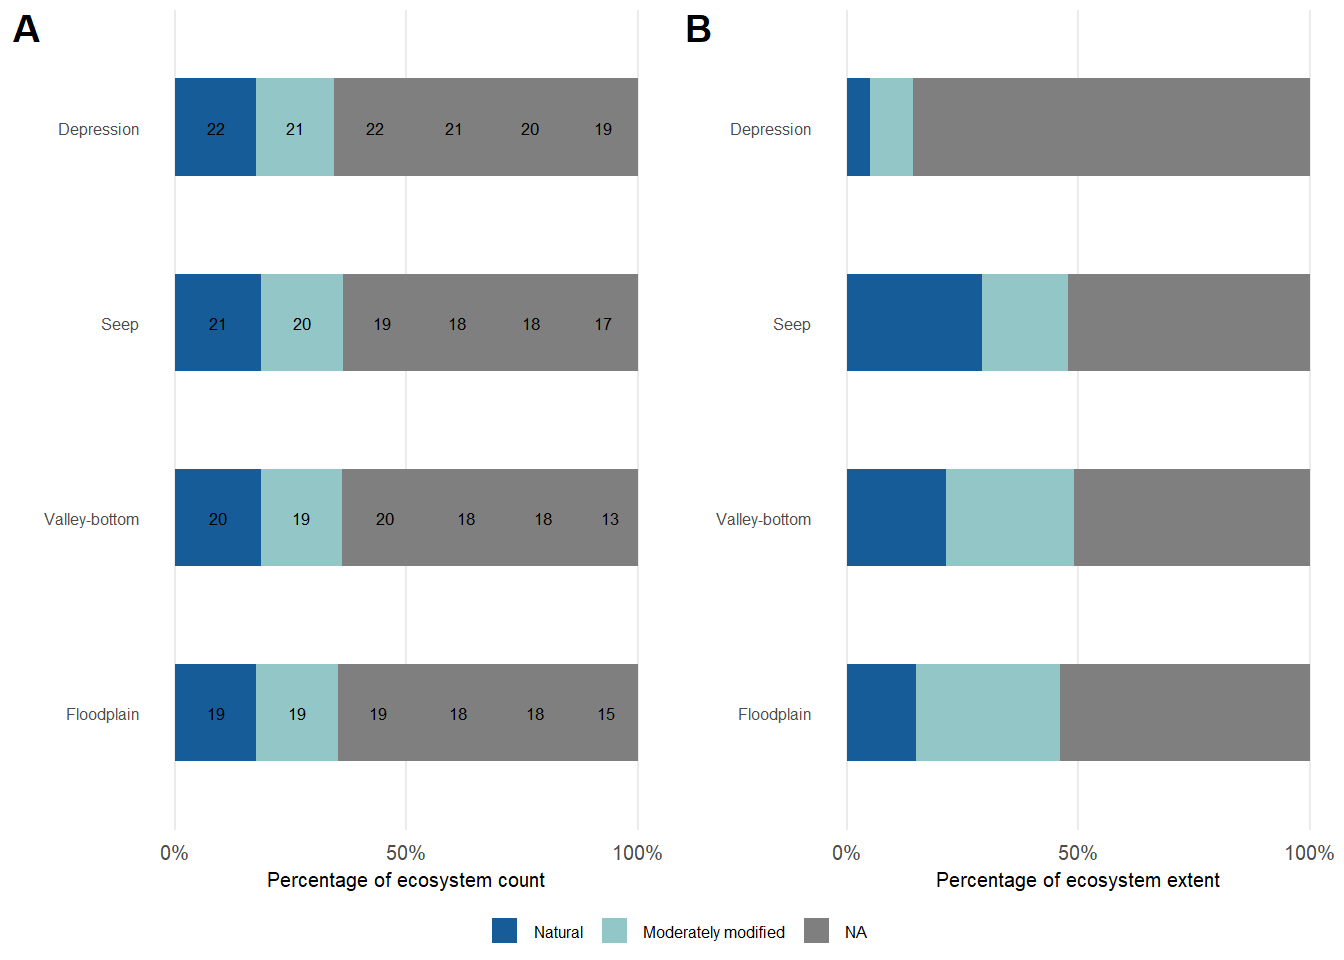
Of the different hydrogeomorphological types, depression wetlands are in the best ecological condition, with 76% in a natural or near-natural condition, with 11% moderately modified and 14% in a heavily to critically modified condition. Floodplain, unchannelled valley-bottom, and seep wetlands have 34%, 35%, 42% of their extent in natural or near-natural ecological condition.
| Natural | Near-natural | Moderately modified | Heavily modified | Severely modified | Critically modified | ||
|---|---|---|---|---|---|---|---|
| Depression | Extent (km2) | 1 396 | 5 070 | 768 | 187 | 127 | 106 |
| Percentage | 18 | 66 | 10 | 2 | 2 | 1 | |
| Seep | Extent (km2) | 1 094 | 597 | 1 327 | 923 | 850 | 164 |
| Percentage | 22 | 12 | 27 | 19 | 17 | 3 | |
| Unchannelled valley-bottom | Extent (km2) | 1 193 | 909 | 856 | 361 | 232 | 30 |
| Percentage | 33 | 25 | 24 | 10 | 6 | 1 | |
| Floodplain | Extent (km2) | 1 706 | 2 801 | 5 132 | 2 759 | 1 215 | 105 |
| Percentage | 12 | 20 | 37 | 20 | 9 | 1 | |
Download the data here.
Approach
Wetlands are complex systems that are influenced by multiple biotic and abiotic factors. Determining wetland health therefore requires a multidisciplinary approach that will allow for determining a single condition score from all the influencing factors. While previous approaches to determine wetland condition were sound, they lacked the holistic and systematic characteristics of the WET-Health Level 1A approach1.
Wetland ecological condition was determined using an automated approach (ArcGIS python scripts) of the Level 1A method described by MacFarlane et al. (2020), which is a low confidence, non-detailed approach that is suitable for assessing multiple wetlands such as those of a national wetland inventory. In addition to being typed according to Ollis et al. (2013)2, the method also requires each wetland to have a 200 m buffer, as well as have its area of influence mapped. While the 200 m buffer is created by the automated process, the area of influence was created using a separate, but also automated, process. This allows the area of influence to be the actual wetland catchment.
Overall wetland condition was calculated from the combined state of wetland hydrology, water quality, geomorphology, and vegetation, which were all calculated from the inferred pressures of different land cover classes.
While allowing for a systematic assessment of wetland condition, the Level 1A approach also allows for the inclusion of in-field validated expert data, a process that has already been initiated through numerous expert engagements during which spatial extent, typing, and wetland condition data were captured for individual wetlands and wetland complexes. Such expert data, along with the Level 1A assessment, contributes towards an improved approach for national wetland condition assessment by building a reference dataset that will directly and indirectly inform future PES assessments.
In addition to allowing for the rapid assessment of multiple wetlands, the automation of a standardised wetland condition assessment method also provides opportunity for future temporal analysis by using land cover grids from different periods as input data. The results will not only reveal the change in wetland condition over time, but also the pressures responsible for such changes.
Future steps
The automated wetland ecological condition is a major step forward in reproducibility and an opportunity for ongoing improvement. It mirrors the categories and framework adopted by practitioners undertaking assessments in the field and sets in place great potential for teasing out drivers of degradation from the perspective of wetland hydrology, water quality, geomorphology or vegetation change, and the development of specific management responses. Going forward, work remains for wide expert engagement to continue inform future wetland ecological condition assessments.
Technical documentation
Coming soon
Related publications and supporting information
Coming soon
Recommended citation
Collins, N.B., Job, N., Awuah, A., Kok, R., Mayekiso, P., Currie, J., Ollis, D., & Kotze, D. 2026. Wetland ecological condition: Freshwater (inland aquatic) realm. National Biodiversity Assessment 2025. South African National Biodiversity Institute. http://nba.sanbi.org.za/.
References
1. Macfarlane, D. et al. 2020. WET-health (version 2): A refined suite of tools for assessing the present ecological state of wetland ecosystems.
2. Ollis, D. et al. 2013. Classification system for wetlands and other aquatic ecosystems in south africa user manual: Inland system. https://doi.org/10.13140/2.1.3857.0248