
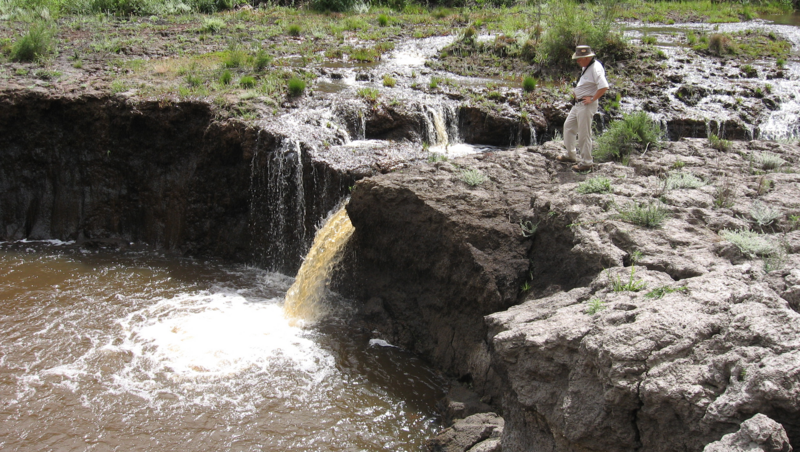
Inland wetlands remain highly threatened, placing the vital services they provide and the incredible biodiversity they support at great risk. Often overlooked, this assessment has highlighted the plight of depression wetlands as one of South Africa’s most threatened wetland types, while the continued loss and degradation of peatlands remains of great concern.
86%
of wetland extent
Threatened
of wetland extent
Threatened
73%
of 82 ecosystem types
Threatened
of 82 ecosystem types
Threatened
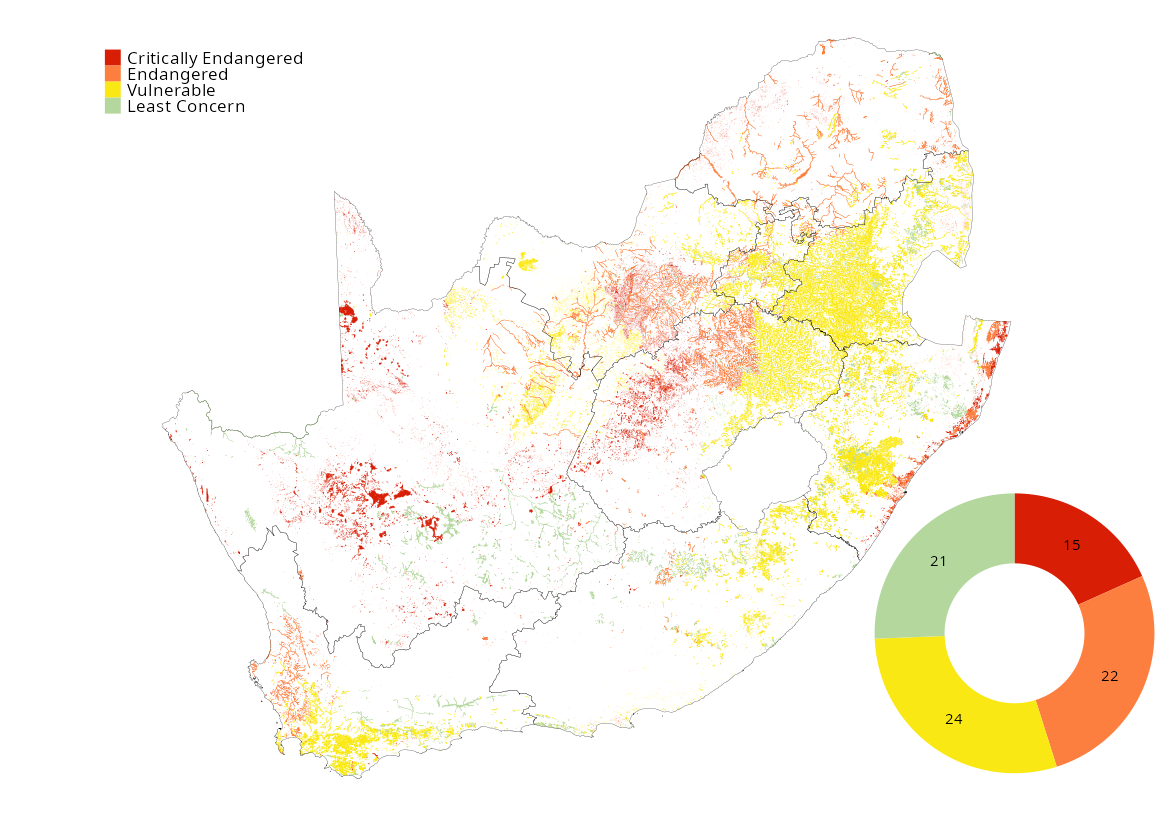
Threatened wetland extent constitutes approximately 2.3 million ha (86%) of the more than 2.6 million hectares of inland wetlands mapped at the time of NBA 2025. Approximately 20% of wetland extent is Critically Endangered, 21% is Endangered, and 45% is Vulnerable. The remaining 14% is assessed as Least Concern.
Of the 82 inland wetland ecosystem types assessed 60 are threatened (73%), with 15 types Critically Endangered (18%), 20 types Endangered (24%), and 25 types Vulnerable (30%). The remaining 22 (28%) wetland types are Least Concern. Threatened wetland ecosystem types are spread widely across South Africa, while Critically Endangered and Endangered wetlands are clustered within the central Free State and extending into central North West province, central Northern Cape, the Swartland of the Western Cape, the mining belt of Limpopo Province and the coastal regions of KwaZulu-Natal.
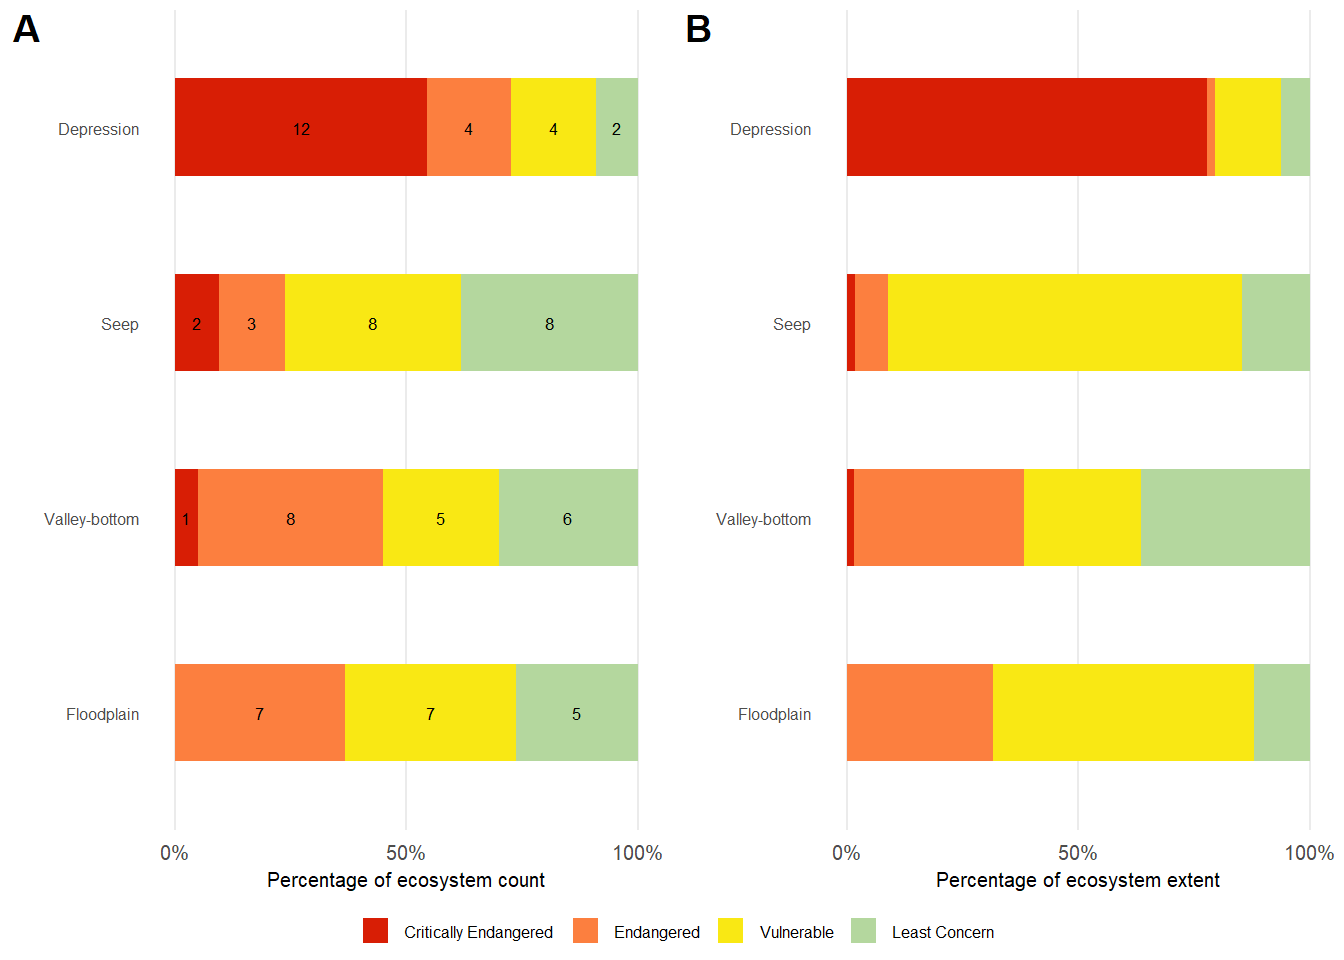
In terms of wetland hydrogeomorphic type, depression wetlands are the most threatened (24% of types threatened), followed by floodplains (17% of types threatened) and unchannelled valley-bottom wetlands (17% of types threatened), and seep wetland types (15% of types threatened) considered threatened. Approximately 14% of depression wetland types and 19% of depression wetland extent is considered to be Critically Endangered, while 2% of seep wetland types, 1% of unchannelled valley-bottom wetland types and no floodplain types are considered Critically Endangered.
| Critically Endangered | Endangered | Vulnerable | Least Concern | ||
|---|---|---|---|---|---|
| Depression | Count | 12 | 4 | 4 | 2 |
| Extent (km2) | 5 947 | 142 | 1 084 | 480 | |
| Seep | Count | 2 | 3 | 8 | 8 |
| Extent (km2) | 84 | 353 | 3 795 | 722 | |
| Unchannelled valley-bottom | Count | 1 | 8 | 5 | 6 |
| Extent (km2) | 58 | 1 310 | 906 | 1 308 | |
| Floodplain | Count | 0 | 7 | 7 | 5 |
| Extent (km2) | 0 | 4 340 | 7 717 | 1 660 | |
Download the data here.
Important note on work in progress
The wetland ecosystem threat status assessment applied the IUCN Red List of Ecosystems framework for the first time. The assessment was based on a robust interim wetland ecosystem typology and an automated assessment of wetland ecological condition. Given the application of a new method and use of new input data, the current results are considered preliminary and a more extensive review of the outputs is still to be completed, with stakeholder engagement continuing through early 2026. It is likely to result in adjustments and an updated assessment, which will be widely communicated.
Approach
The assessment was conducted using the IUCN Red List of Ecosystems framework (version 2), which has been applied across all realms for the 2025 assessments. The framework uses the concept of ecosystem collapse as the equivalent endpoint to species extinction. It evaluates the status of each ecosystem type using a set of quantitative and qualitative criteria linked to the key aspects of ecosystem decline, namely, Criterion A: reduction in extent, Criterion B: restricted distribution, Criterion C: environmental degradation and Criterion D: biotic degradation. Read more about this indicator on the About ecosystem threat status page.
The following criteria were assessed for inland wetland ecosystems:
Criterion A2b current and future rate of decline in ecosystem extent, assessed based on land cover change rates between 1990 and 2022, and projected forward to 2040.
Criterion A3 historical decline in ecosystem extent, assessed based on land cover 2022, compared to historical potential extent.
Criterion B1ai restricted extent of occurrence coupled with decline was calculated, with ongoing decline defined as a habitat loss rate of decline of >= 0.4% per year calculated from land cover change data.
Criterion B1aii restricted extent of occurrence coupled with decline was calculated, with ongoing decline defined as a decline in the extent of good/moderate ecological condition wetland extent (PES Classes A, B, C) from the previous PES assessment period (2018 - 2024).
Criterion D2b was applied using the rate of change in condition between 2018 and 2024, projected forward to 2068 (a 50 year period).
Criterion D3 was applied to the wetland ecological condition (PES) category (A-F) such that severity of biotic disruption of >= 90% was assumed for PES categories E-F; Severity >=70% was assigned to PES categories D-F; Severity >=50% was assigned to PES categories C-F. The rating was applied to each element of PES, namely, vegetation, water quality, geomorphology, hydrology, and the overall Wet-Health score that combines these elements.
Each wetland ecosystem type was assessed against these criteria and the highest risk category triggered by any single criterion was assigned as the overall ecosystem threat status for that type. Each of the 82 inland wetland ecosystem types was placed into one of four risk categories: Critically Endangered, Endangered, Vulnerable, or Least Concern. Critically Endangered, Endangered, and Vulnerable are collectively referred to as the threatened categories.
Technical documentation
Code repository
Skowno, A.L. 2025. SANBI-NBA Wetland ecosystem threat status [Source code]. GitHub repository available at https://github.com/askowno/RLE_wet
Related publications and supporting information
Harris, L.R., Skowno, A.L., Holness, S.D., Sink, K.J., van Niekerk, L., van Deventer, H., Smith-Adao, L., Job, N., Khatieb, S., Monyeki, M. (in review). Indicators for tracking progress in effective, representative ecosystem protection.
Recommended citation
Job, N., Skowno, A., Currie, J., & Collins, N. 2026. Wetland ecosystem threat status: Freshwater (inland aquatic) realm. National Biodiversity Assessment 2025. South African National Biodiversity Institute. http://nba.sanbi.org.za/.