
Less than half (45%) of South Africa’s 163 marine ecosystem types are threatened, with inshore and shelf ecosystem types more threatened than those in the slope, abyss and open ocean. Ecosystem types of smaller extent are at greater risk. Unsustainable sea use can undermine the benefits from healthy ecosystems and the natural capital that can support a thriving ocean economy (key message A2). Collaborative efforts are needed to improve ecological condition and inclusive marine biodiversity planning. Strategic Marine Spatial Planning can safeguard natural capital while enabling economic development.
45%
of 163 ecosystem types
Threatened
of 163 ecosystem types
Threatened
4%
of 163 ecosystem types
Critically Endangered
of 163 ecosystem types
Critically Endangered
19%
of 163 ecosystem types
Endangered
of 163 ecosystem types
Endangered
22%
of 163 ecosystem types
Vulnerable
of 163 ecosystem types
Vulnerable
Ecosystem threat status results
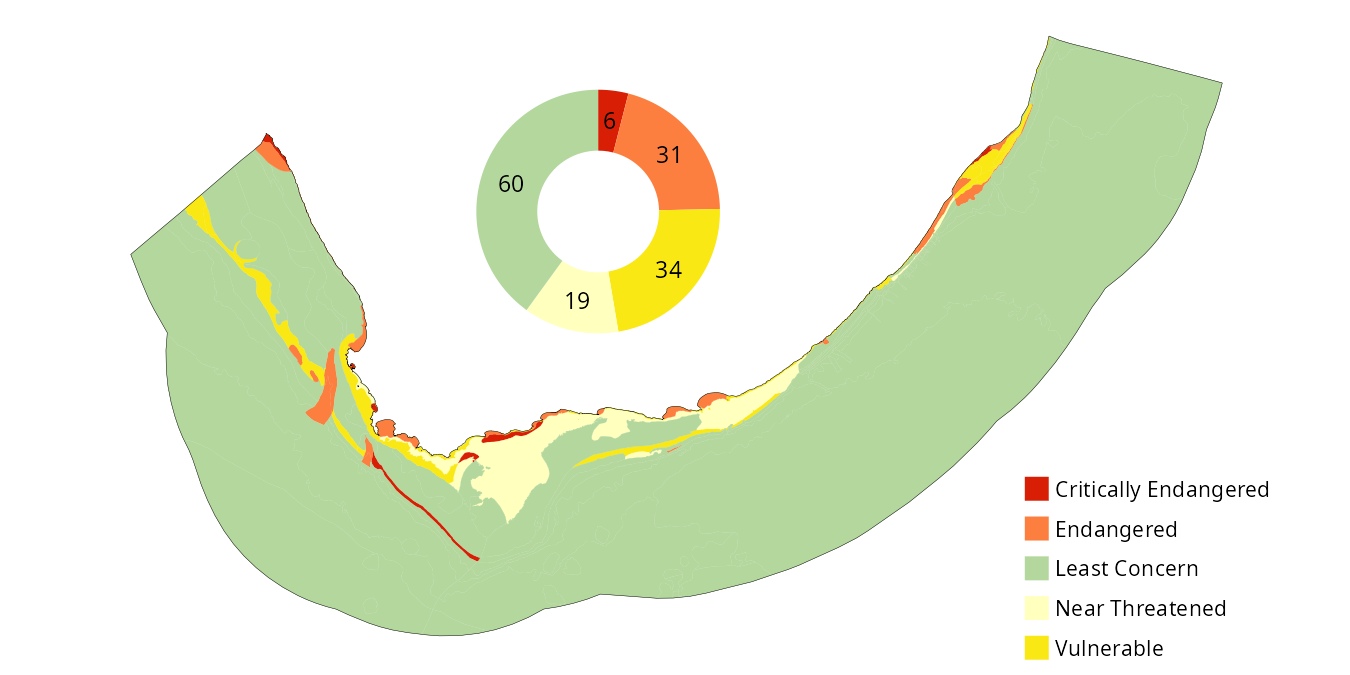
While 45% of South Africa’s 163 marine ecosystem types are threatened, this represents only 5% of the total area of the marine realm. Note that the area estimates include both benthic and pelagic area beyond the shelf but do not include the subantarctic territory. Inshore and shelf ecosystem types are generally more threatened than those falling within the slope, abyss and open ocean regions. Ecosystem types of smaller extent and that are less widely distributed are at greater risk of extinction1. Overall, six ecosystem types (4% of types) are Critically Endangered, with 31 (19%) Endangered and 36 (22%) Vulnerable. Of the remaining ecosystem types, 19 (12%) and 71 (44%) were Near Threatened and Least Concern, respectively.
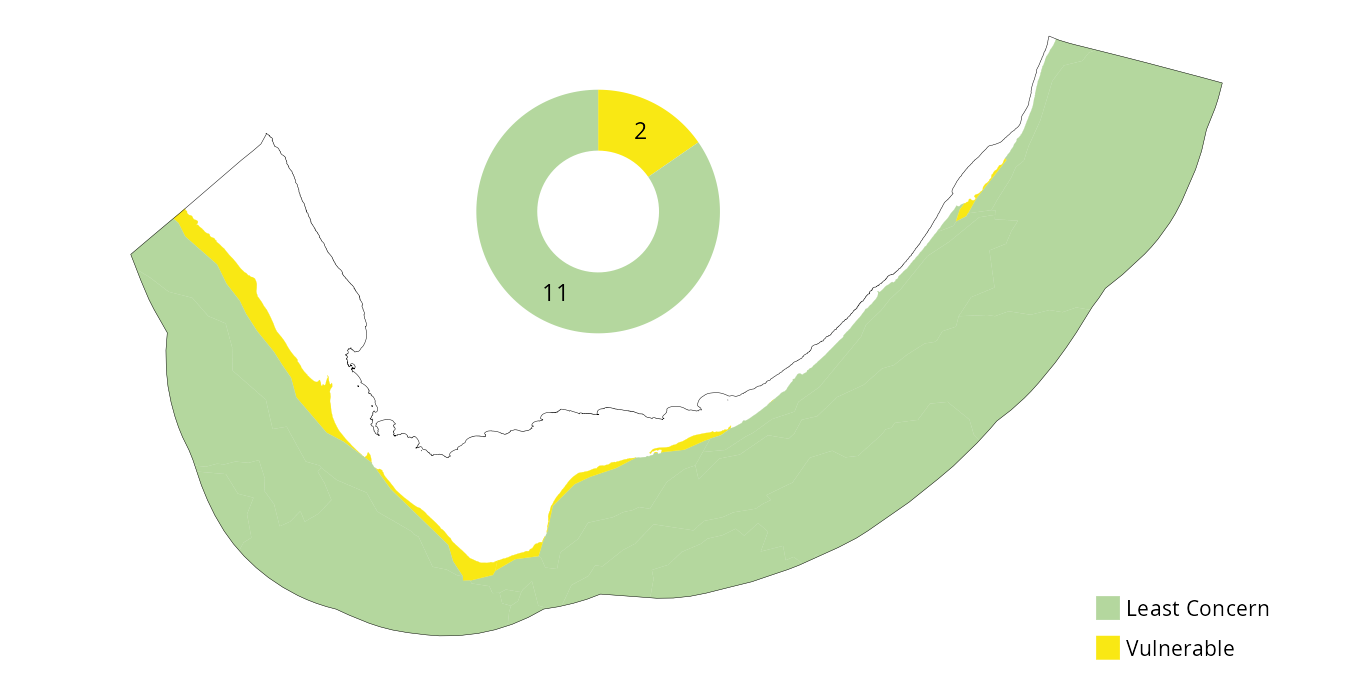
The locations of the threatened ecosystem types are shown in Figure 1 (Benthopelagic and deepsea benthic) and Figure 2 (pelagic). The cold temperate Southern Benguela region has more threatened ecosystem types than the warm temperate Agulhas region, while KwaZulu-Natal also has several threatened ecosystem types.
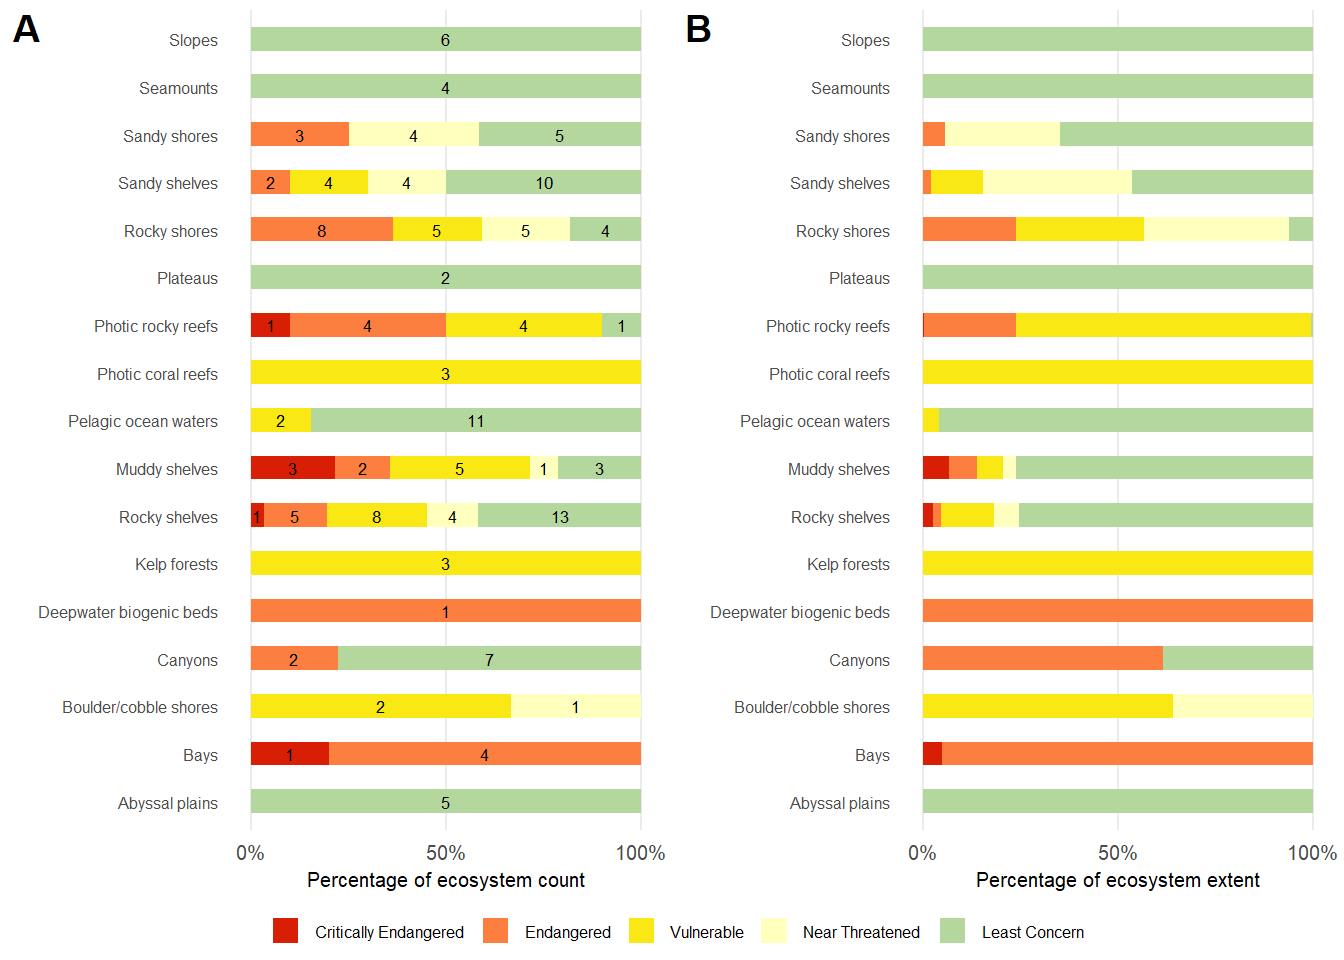
The most threatened functional groups include bays, deepwater biogenic beds, muddy shelves and rocky ecosystems on the shelf (Figure 3). The IUCN Red List of Ecosystems (RLE) assessment method used to calculate threat status is outlined in the Approach section below and further detail can be found in the ecosystem threat status and RLE explainer page.
| Critically Endangered | Endangered | Vulnerable | Near Threatened | Least Concern | ||
|---|---|---|---|---|---|---|
| Abyssal plains | Count | 0 | 0 | 0 | 0 | 5 |
| Extent (km2) | 0 | 0 | 0 | 0 | 402 328 | |
| Bays | Count | 1 | 4 | 0 | 0 | 0 |
| Extent (km2) | 254 | 5 113 | 0 | 0 | 0 | |
| Boulder/cobble shores | Count | 0 | 0 | 2 | 1 | 0 |
| Extent (km2) | 0 | 0 | 3 | 2 | 0 | |
| Canyons | Count | 0 | 2 | 0 | 0 | 7 |
| Extent (km2) | 0 | 5 233 | 0 | 0 | 3 284 | |
| Deepwater biogenic beds | Count | 0 | 1 | 0 | 0 | 0 |
| Extent (km2) | 0 | 104 | 0 | 0 | 0 | |
| Kelp forests | Count | 0 | 0 | 3 | 0 | 0 |
| Extent (km2) | 0 | 0 | 29 | 0 | 0 | |
| Muddy shelves | Count | 3 | 2 | 5 | 1 | 3 |
| Extent (km2) | 2 572 | 2 739 | 2 650 | 1 278 | 29 506 | |
| Pelagic ocean waters | Count | 0 | 0 | 2 | 0 | 11 |
| Extent (km2) | 0 | 0 | 34 579 | 0 | 807 366 | |
| Photic coral reefs | Count | 0 | 0 | 3 | 0 | 0 |
| Extent (km2) | 0 | 0 | 26 | 0 | 0 | |
| Photic rocky reefs | Count | 1 | 4 | 4 | 0 | 1 |
| Extent (km2) | 5 | 827 | 2 629 | 0 | 18 | |
| Plateaus | Count | 0 | 0 | 0 | 0 | 2 |
| Extent (km2) | 0 | 0 | 0 | 0 | 14 062 | |
| Rocky shelves | Count | 1 | 5 | 8 | 4 | 13 |
| Extent (km2) | 2 164 | 1 657 | 11 506 | 5 414 | 63 590 | |
| Rocky shores | Count | 0 | 8 | 5 | 5 | 4 |
| Extent (km2) | 0 | 147 | 203 | 230 | 39 | |
| Sandy shelves | Count | 0 | 2 | 4 | 4 | 10 |
| Extent (km2) | 0 | 1 907 | 12 557 | 36 197 | 44 030 | |
| Sandy shores | Count | 0 | 3 | 0 | 4 | 5 |
| Extent (km2) | 0 | 21 | 0 | 110 | 241 | |
| Seamounts | Count | 0 | 0 | 0 | 0 | 4 |
| Extent (km2) | 0 | 0 | 0 | 0 | 6 151 | |
| Slopes | Count | 0 | 0 | 0 | 0 | 6 |
| Extent (km2) | 0 | 0 | 0 | 0 | 413 581 | |
Critically Endangered
The six ecosystem types that are Critically Endangered cover 0.3% of the ocean area. The Agulhas Muddy Mid Shelf is threatened by demersal trawling (that persists over much of the extent of this ecosystem type2) in addition to flow reduction. The Browns Bank Rocky Shelf Edge has also been subject to intensive demersal trawling and high demersal longline effort leading to poor ecological condition. Both these ecosystem types were reported as Critically Endangered in 20183 under IUCN RLE Criterion C/D.
Four additional small ecosystem types listed under this category in 2025, when strictly applying IUCN RLE Criterion B. The Orange Cone Inner Shelf Mud Reef Mosaic is impacted by ongoing flow reduction and marine mining. The KwaZulu-Natal Bight Muddy Inner Shelf has been modified by flow reduction and the demersal inshore crustacean inshore fishery that has subsequently ceased. Cape Bay, which includes Table and Saldanha Bay, has very high cumulative pressures with ongoing degradation linked to port and harbour activities. The Aliwal Shoal Reef Complex falls entirely within a Marine Protected Area (MPA) but ongoing linefishing, waste water discharge and lethal shark control measures cause this ecosystem type, which is of restricted distribution, to be classified as Critically Endangered. Further work to support reef classification and measure ecosystem condition is recommended along with management to reduce pressures in the MPA.
NoteBox 1. The effect of ecosystem extent thresholds on ecosystem threat status results
Ecosystem types of smaller extent and limited distributed generally face greater risk of collapse1. In 2025, the application of the IUCN 2024 RLE guidelines led to several of these ecosystem types being up-listed to more threatened categories under criterion B. The IUCN guidelines provide set thresholds of ecosystem extent which determine ecosystem threat status, however, there are no accompanying thresholds for ecosystem modification (degradation or disruption). Without a precise understanding of the rates of change in ecosystem condition, calibrating this criterion is a challenge, potentially resulting in the assignment of an inflated risk assessment that is not supported by experts.
Aliwal Shoal met the criteria for a Critically Endangered ecosystem type because of its restricted distribution (small extent) and ongoing decline in ecosystem condition. Under criteria C and D Aliwal Shoal was assessed as Vulnerable, which may be more plausible. Further, improved management of pressures, including fishing, pollution and lethal shark control could see this ecosystem type assessed as Least Concern in the future. Additional research is needed to support reef ecosystem classification and mapping. When countries are mapping national ecosystem types it is useful to keep these thresholds, that can drive threat status results, in mind. Further work is needed to better understand the influence of ecosystem extent and distribution on ecosystem risk assessment. Assessments at multiple scales provide useful insights.
Endangered
There are 31 Endangered ecosystem types (19%) which cover 0.9% extent of the marine realm area. Many of these are ecosystem types of limited extent that were uplisted (considered more threatened) relative to 2019 due to the application of global standards in 2025. For example, False and Walker Bay, St Helena Bay and Eastern Agulhas Bays (Algoa and St Francis) are all Endangered under either criterion B1 or B2 of the IUCN RLE.
Vulnerable
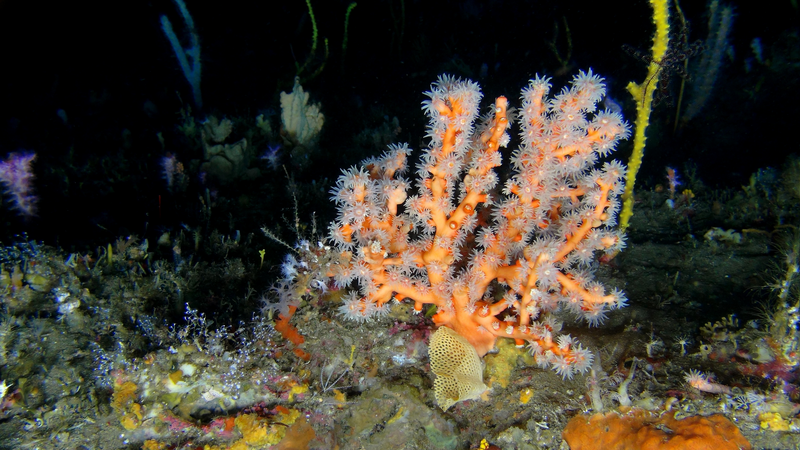
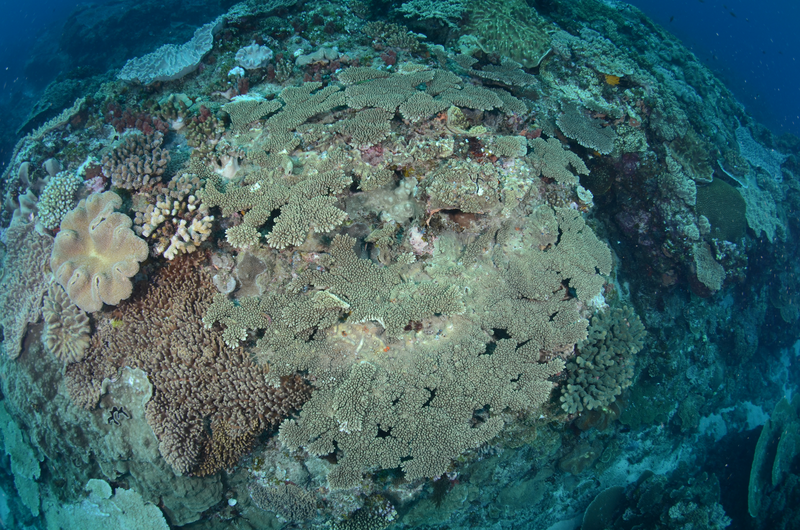
Vulnerable ecosystem types cover 3.4% of the ocean space, with 36 ecosystem types (22%) falling within this category. All three kelp ecosystem types in South Africa are Vulnerable with cumulative fishing activities playing a key role in declining condition. Two of the 13 pelagic ecosystem types are threatened (South Atlantic Productive Margin Water and Upwelled Agulhas Current Margin Water), both of these being Vulnerable. Key pressures driving decline in condition include large pelagic fishing and mid water trawling. In 2025, all three coral communities were assessed as Vulnerable under the IUCN RLE criterion B3, with coral bleaching and associated ecosystem modification caused by climate change considered the key threat that could lead to ecosystem collapse. This also aligns with the IUCN RLE result for the Delagoa ecoregion in the regional assessments for the Western Indian Ocean4.
Near Threatened
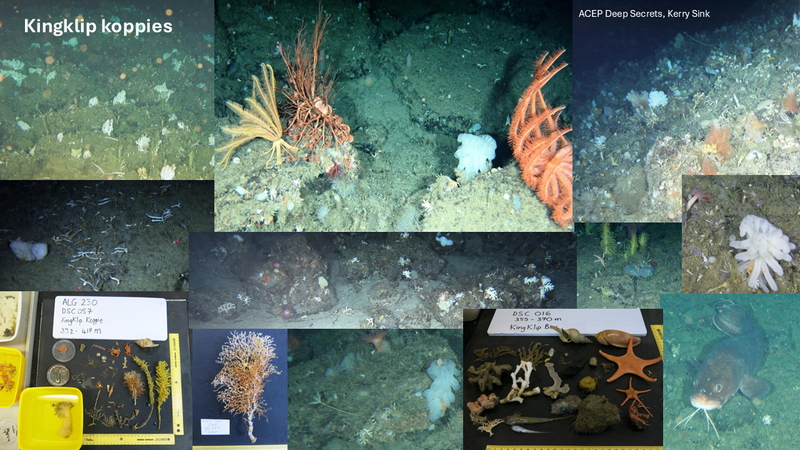
Near Threatened ecosystem types are those that were evaluated to be within 10% of the threshold for Vulnerable. These ecosystems are at risk of becoming threatened if increasing pressures lead to further degradation in ecological condition. Examples include the Kingklip Koppies and the Agulhas Exposed Stromatolite Rocky Shore.
Approach
The 2025 assessment of South Africa’s 163 marine ecosystem types was conducted using the 2024 Guidelines for the application of IUCN Red List of Ecosystems Categories and Criteria and drawing from previous NBA assessments. The threat status of South Africa’s 163 marine ecosystem types was evaluated applying the IUCN Criteria A-D using pressure and condition maps from the 2018 assessment. Both the extent and severity of ecosystem degradation were considered by calculating the extent of ecosystem types in each of the four ecosystem condition categories. Condition assessments were based on a cumulative pressure score informed by pressure maps and an ecosystem pressure matrix that weights the impact of each pressure on each ecosystem type3.
As pressure and condition data sets were not updated for the 2025 assessment, it is important to note that changes in ecosystem threat status are largely as a result of refined methods rather than recent loss or degradation in marine ecosystems. New aspects that were considered in the 2025 assessment included Criterion A, habitat loss, and Criterion B, number of threat defined locations, ongoing non-trivial drivers of ecological degradation (as opposed to pressures that have ceased) and stochastic events. Several ecosystem types have shifted into more threatened categories due to the ecosystem extent thresholds provided by the IUCN, but 13 ecosystem types had more positive (less threatened) results due to stricter thresholds for ongoing non-trivial decline in ecological condition.
The application of the IUCN global standards supported a more comprehensive understanding of the implications of previous deviations from the IUCN guidelines (such as altered thresholds under Criterion B in 2018) and provided a broader range of plausible results. It also led to the identification of new research priorities and recommendations relevant to current ecosystem mapping efforts and future ecosystem condition assessments that will strengthen RLE assessments. See the ecosystem threat status and RLE explainer page for further information on South Africa’s approach to the assessment of ecosystem threat status.
Acknowledgements
The National Marine Biodiversity Scientific Working Group is thanked for its role as reference group for the Marine Realm Assessment of the NBA. We also thank the National Marine Ecosystem Committee and Network for their peer review and shared insights on ecosystem assessment. We acknowledge the authors of the NBA 2018 Ecosystem Threat Status chapter. We thank Jose Ferrer Paris and David Keith for helpful discussions that informed our application of the 2024 IUCN Red List of Ecosystems Guidelines. Jennifer Olbers and Mike Schleyer are thanked for additional insights on Aliwal Shoal. The European Union’s Horizon 2020 research and innovation program under Grant Agreement No. 862428 (MISSION ATLANTIC) is thanked for supporting the 2025 NBA ecosystem threat status assessment and the planned scientific publication.
Technical documentation
Code repositories
Data
Table of marine ecosystem types protection level and threat status
Key publications
Sink, K.J. et. al. in prep. Iterative improvement in marine ecosystem threat status assessment in South Africa to support sustainable ocean economy decisions.
Sink, K.J. et al. 2019. Chapter 7: Ecosystem Threat Status, in: Sink, K.J. et al. (Eds.), South African National Biodiversity Assessment 2018 Technical Report Volume 4: Marine Realm. South African National Biodiversity Institute, Pretoria, pp. 249–282.
Harris, L.R. et al. 2025. Sandy beach ecosystem and species red listing highlight priorities for beach conservation and restoration. Estuarine, Coastal and Shelf Science, p.109447. https://doi.org/10.1016/j.ecss.2025.109447
Rowland, J.A. et al. 2020. Ecosystem indices to support global biodiversity conservation. Conservation Letters 13, 11. https://doi.org/10.1111/conl.12680
IUCN. 2024. Guidelines for the application of IUCN Red List of Ecosystems. Gland, Switzerland. https://doi.org/10.2305/CJDF9122
Recommended citation
Sink, K.J., Besseling, N.A., Harris, L.R., Holness, S., Kirkman, S.P., Porter, S.N., Majiedt, P.A., Dunga, L.V., Atkinson, L.J., Bernard, A.T.F., Franken, M., Karenyi, N., Rylands, S., Smit, K.P., Currie, J.C., & Skowno, A.L. 2026. Ecosystem threat status: Marine realm. National Biodiversity Assessment 2025. South African National Biodiversity Institute. http://nba.sanbi.org.za/.
References
1. Keith, D.A. et al. 2013. Scientific foundations for an IUCN red list of ecosystems. PLoS ONE 8: e62111. https://doi.org/10.1371/journal.pone.0062111
2. Currie, J. et al. 2023. Mapping fine-scale demersal trawl effort for application in ecosystem assessment and spatial planning. African Journal of Marine Science 1–15. https://doi.org/10.2989/1814232X.2023.2241885
3. Sink, K.J. et al. 2019. Chapter 7: Ecosystem threat status. In Sink, K.J. et al. (eds),: 249–282. South African National Biodiversity Institute, Pretoria.
4. Obura, D. et al. 2021. Vulnerability to collapse of coral reef ecosystems in the western indian ocean. Nature Sustainability 5: 104–113. https://doi.org/10.1038/s41893-021-00817-0