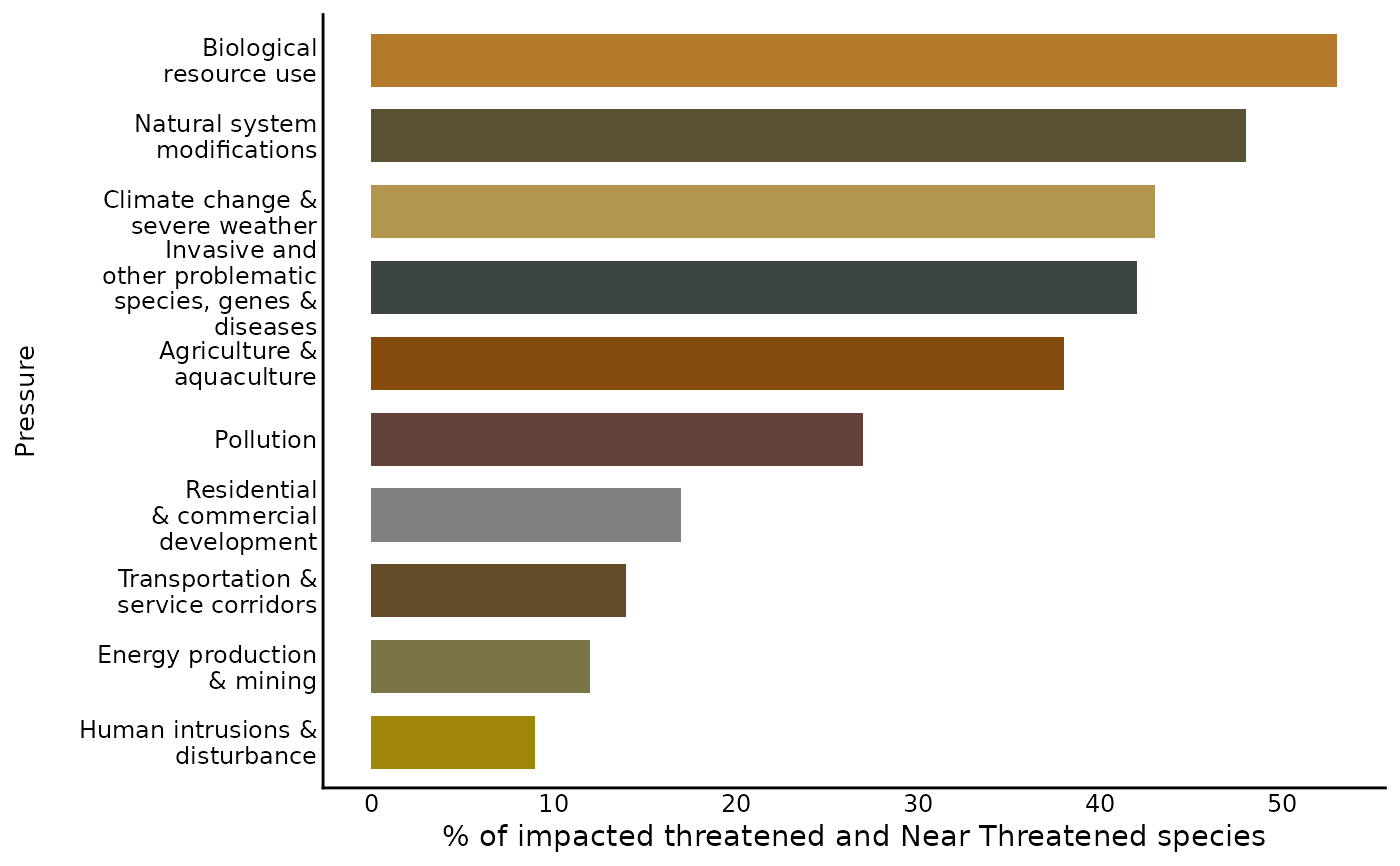
This function generates a horizontal bar plot showing the percentage of pressures
affecting taxa.
Usage
nba_pressure_bar_plot(DF, TAXON = NULL, SAVE = NULL)
Arguments
- DF
A data frame containing at least the columns Taxon, pressure, and percentage.
- TAXON
The name of the taxon to filter for.
- SAVE
The name of the output file that will be saved to the output folder. If you do not have an outputs folder you will be prompted to make one.
Value
A horizontal bar plot.
Examples
birds_press_bar_plot <- nba_pressure_bar_plot(
                          DF = NBA_example_press_bar_data,
                          TAXON = "Birds")

birds_press_bar_plot