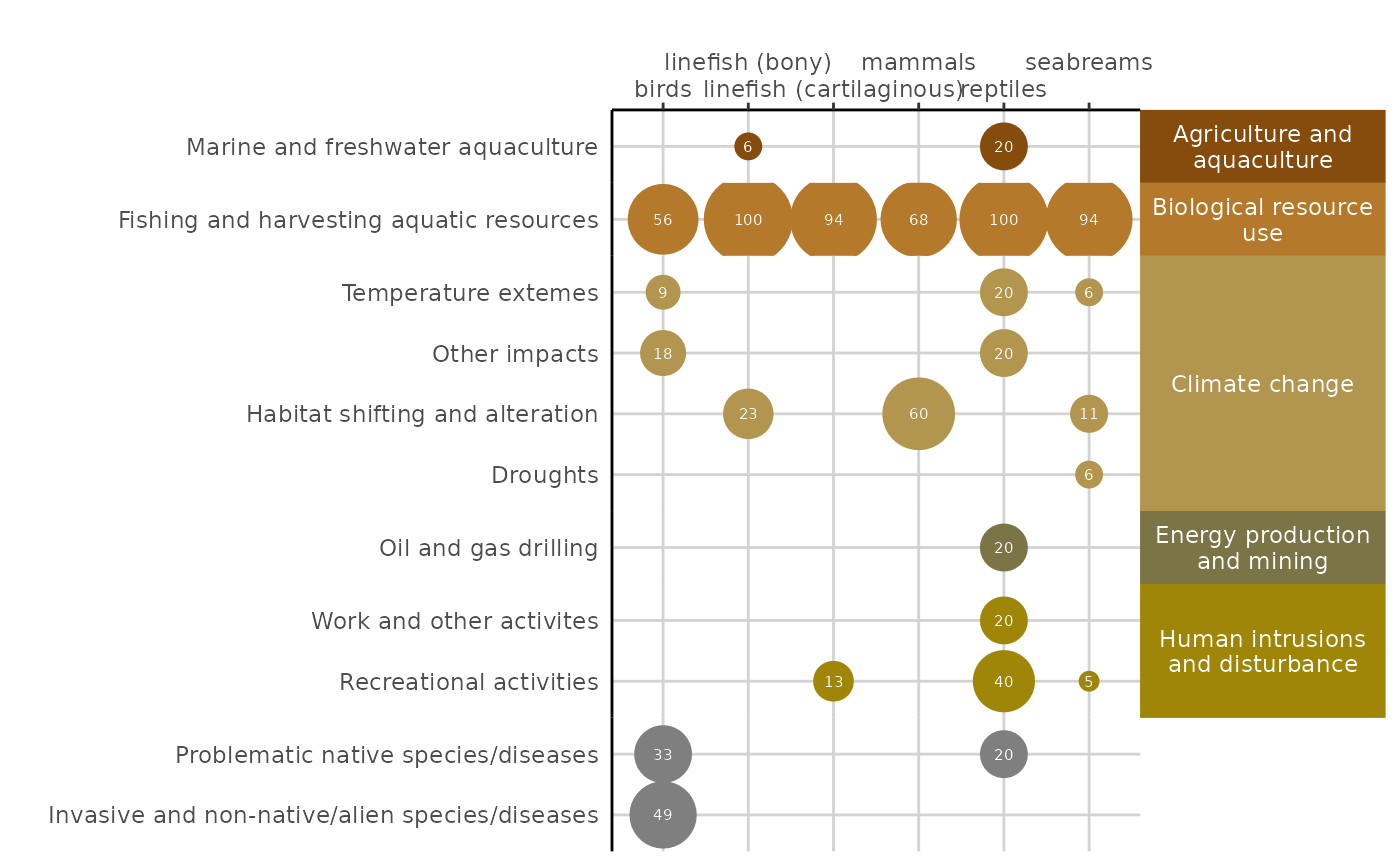
This function will create bubble plot intended for creation of the percentage of taxa of ecological concern impacted by various pressures
Arguments
- DF
The data frame that contains the information
- GROUP
The grouping variables (taxa group, etc)
- CAT
The overall pressure category
- SUB_CAT
The sub pressure category
- VALUE
The percentage of taxa of ecological concern impacted by the pressure
- SAVE
The name of the output file that will be saved to the output folder. If you do not have an outputs folder you will be prompted to make one.
Details
Please use the example dataset NBA_bubble_plot_example_data to see how the data should be formatted.
If you would only like to desplay once set of categories then you can set SUB_CAT or CAT = "" and it will not appear.
Examples
bubble_plot <- nba_plot_bubble(DF = NBA_example_bubble_data,
                        GROUP = taxon_group,
                       CAT = pressure,
                       SUB_CAT = sub_pressure,
                       VALUE = perc_concern_under_press,
                        SAVE = NULL)
#> Warning: The `size` argument of `element_line()` is deprecated as of ggplot2 3.4.0.
#> ℹ Please use the `linewidth` argument instead.
#> ℹ The deprecated feature was likely used in the nbaR package.
#>   Please report the issue at <https://github.com/TashBes/NBA.package/issues>.

bubble_plot
#> Warning: Removed 41 rows containing missing values or values outside the scale range
#> (`geom_point()`).
#> Warning: Removed 41 rows containing missing values or values outside the scale range
#> (`geom_text()`).