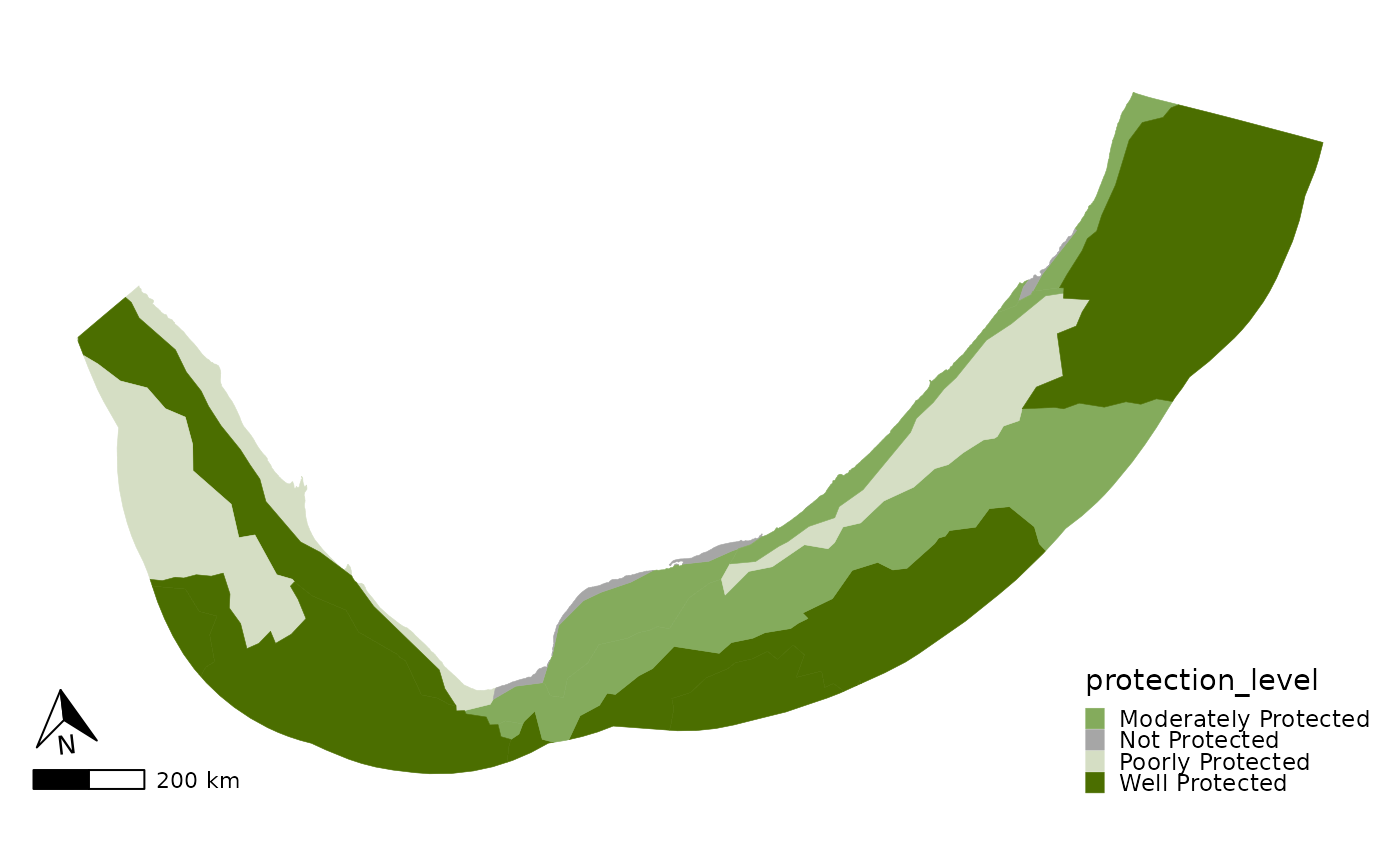
NBA maps for protection level, threat status, and condition. The function can take a dataset with either one polygon or multipolygon per ecosystem (each row has a unique ecosystem) or multiple rows per ecosystem type.
Usage
nba_map(
  DF,
  GEOM = c("vector", "raster"),
  FILL,
  LEGEND = FALSE,
  MOE = FALSE,
  LWD = 0.1,
  SCALE_TEXT = 1
)
Arguments
- DF
The data frame that contains the information
- GEOM
Whether the layer is a vector or a raster. Vectors must be sf objects and rasters must be terra (spatraster) objects
- FILL
The column that contains the categories to colour the ecosystems by (e.g. protection level, threat status, or condition)
- LEGEND
True to include the legend in the plot, False to exclude it
- MOE
True to include the Map orientation elements (MOE) of a scale bar and north arrow, False to exclude
- LWD
Line width to use in the plot
- SCALE_TEXT
scale the sizes of the plot text to fit your intended output. currently set at 1 as default. If you want to save it to 8 by 6 cm, set it to 0.5.
Details
The function expects an sf object.
Please look at the example data NBA_example_map_data to see the correct structure for the data.
The name of the fill column is irrelevant, but the categories must be spelled correctly (there is a list of the standard spellings/ cases of NBA categories named nbaR::NBA_categories in this package, which can be accessed for reference).